On December 31, 2019, in the city of Wuhan, China, a port city of 11 million people, the World Health Organization (WHO) was informed of several unusual cases of pneumonia. A week later, the WHO announced they had identified a new virus, part of the coronavirus family, and named it COVID-19.
The first death in the U.S. was on March 5 in Washington state. By that time the global death toll had grown to about 3,500 people. By the first week of March, Italy had closed all its schools. By March 11, the Trump administration had restricted travel from Europe for 30 days. A day later, the WHO would report over 117 countries with confirmed cases of the illness – the number of infected reaching over 125,000.
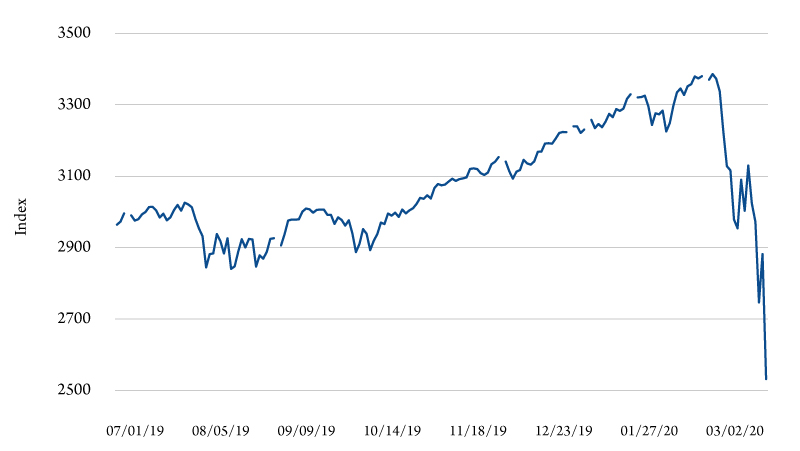
The effect of the coronavirus outbreak has rippled through global economies. The S&P 500, which had peaked at 3,386 on February 19, had fallen roughly 25 percent to 2,532 by March 12. The VIX index, which measures stock market volatility and is often referred to as the fear index, reached 75.5 – its highest level ever.
Over the same period, the benchmark 10-year bond yield fell 1 percentage point to .84 percent – after bottoming out at .54 on March 9 – as investors fled to safety. While longer maturity bond yields have generally drifted downwards over the past 40 years, the deviation from the long run trend (about -1.8 percentage points) is on par with the rates seen during the last financial crisis.
Figure 1 shows the 10-year bond yield and the VIX index, July 1, 2019, through March 12, 2020. The 10-year bond yields dropped dramatically at the end of February. As of mid-March, 10-year yields have stabilized between .50 – .75 percent.
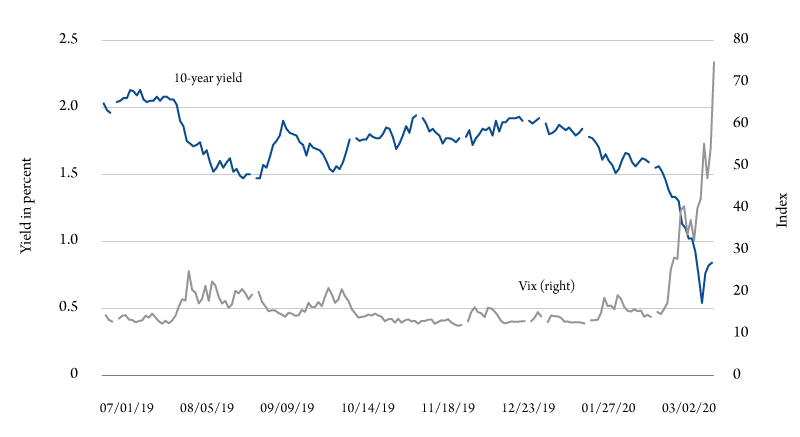
Figure 2 shows the S&P 500 index for the same period. Together the data show the significant global economic impact of COVID-19. Movement in each of the indicators represent new information and uncertainty regarding the future of this pandemic.
Lost in the hubbub is the recent price war between Russia and Saudi Arabia that drove oil down to below $40 a barrel – futures markets forecast sub-$50 until December 2023. Break even for the Bakken oil field in North Dakota is $50 bbl (barrel of oil). Add to that the ongoing trade war, uncertainty surrounding Brexit and you have a potent brew of economic turmoil. Though none of these events have had a similar impact on financial markets as COVID-19 has – tariffs imposed by the U.S. increased the VIX index to 40.7.
Financial markets are interpreted as a barometer of the underlying health of an economy – they are pushed by economic shocks. Negative shocks can push the economy towards a recession or a slow-down, while positive shocks accelerate the economy. Recessions are the result of either supply- or demand-side shocks. Demand-side shocks are more frequent. They result in rising unemployment, correspondingly slower economic growth and falling inflation. On the other hand, supply shocks are accompanied by higher unemployment and inflation.

The coronavirus is the economic equivalent of a perfect storm consisting of both negative supply and demand shocks. Because both shocks are happening simultaneously, macroeconomic models demonstrate that inflation will remain muted, but output growth will slow or become negative.
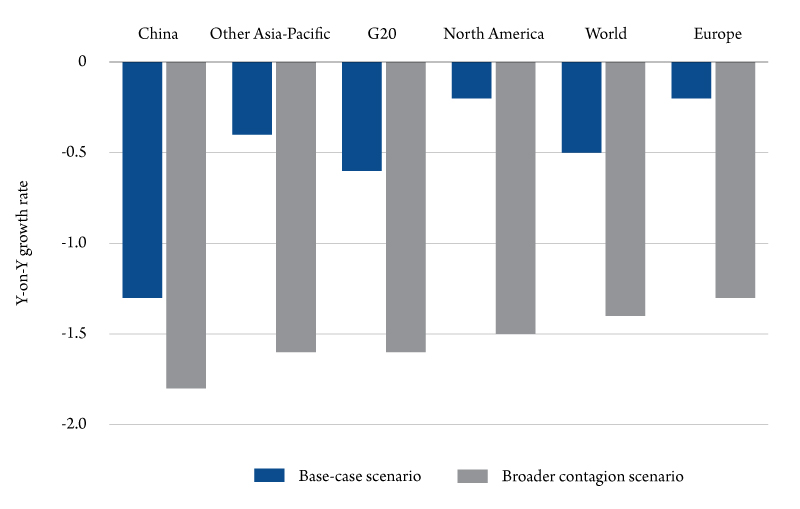
Base case estimates from the Organization of Economic Cooperation and Development (OECD) show that if the virus is contained, global growth will be about .5 percent below previous projections. The U.S. forecast has been reduced by .1 percent to a year-on-year growth rate of 1.9 percent. The OECD also considered a downside scenario, which is looking more realistic, that will have a larger impact on the global economy – about a 1.5 percent fall in global GDP (Figure 3).
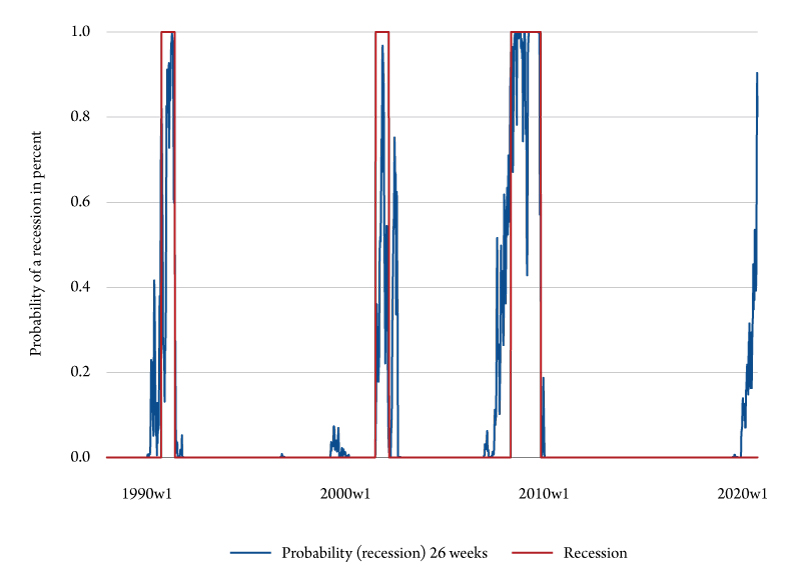
Most economists and economic institutions, e.g. The International Monetary Fund, World Bank and Organization of Economic Cooperation and Development, all agree what the sources of the negative supply and demand shocks are, which are highlighted in Table 1. Concentrating first on the supply-side, the supply chain has received most of the attention. And much of this has to do with the intermediate parts in Asia. Many have pointed to the SARS crisis as the best comparable precedent to the current pandemic. However, COVID-19 is likely to have further-reaching economic consequences than SARS, because China’s role in the world economy has more than doubled since 2002.
One of the first industries to feel the impacts of the coronavirus on the supply chain was the automobile industry. In February, Italian Fiat-Chrysler had to temporarily shut down plants in Serbia because it couldn’t get parts from China, leading to further disruptions downstream and further supply-side shocks.
On the demand-side, if people are temporarily idled, incomes begin to decline, along with spending. This is exacerbated by the loss of confidence and declines in household wealth, manifested through a falling stock market. Declines in travel will have a pronounced effect on tourism. For example, tourism accounts for roughly 13 to 15 percent of Italian GDP – Italy could very well be in a recession right now.
Recession?
How has this shifted the discussion about whether or not global economies will experience a recession this year? Most experts agree that the probability of a recession this year has increased dramatically to between 50 and 90 percent.
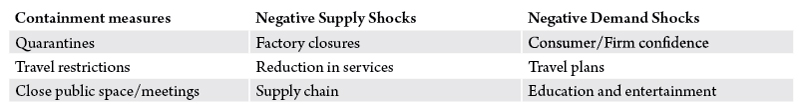
Using a variation of a model proposed by the Federal Reserve Bank of New York, we estimate the probability of a recession for 2020 in Figures 4a through 4c. They show the probability of a recession in the U.S. over eight, 13- and 26- week future time horizons.
The blue line represents the estimated probabilities and the red line is official NBER recession dates. The figures show the probability of a recession in the U.S. grew dramatically in the first eight weeks or so of 2020 – going from effectively zero in the first week of January 2020 to about an 89 percent chance of recession within 26 weeks.
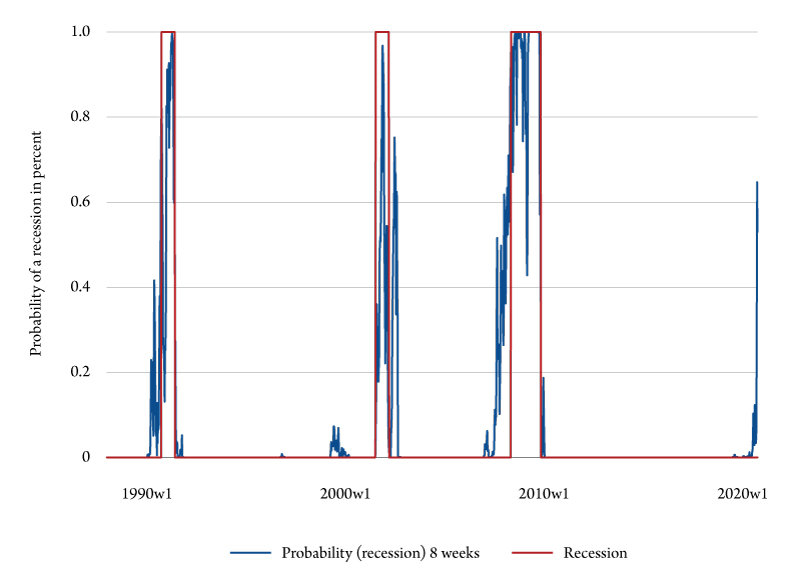
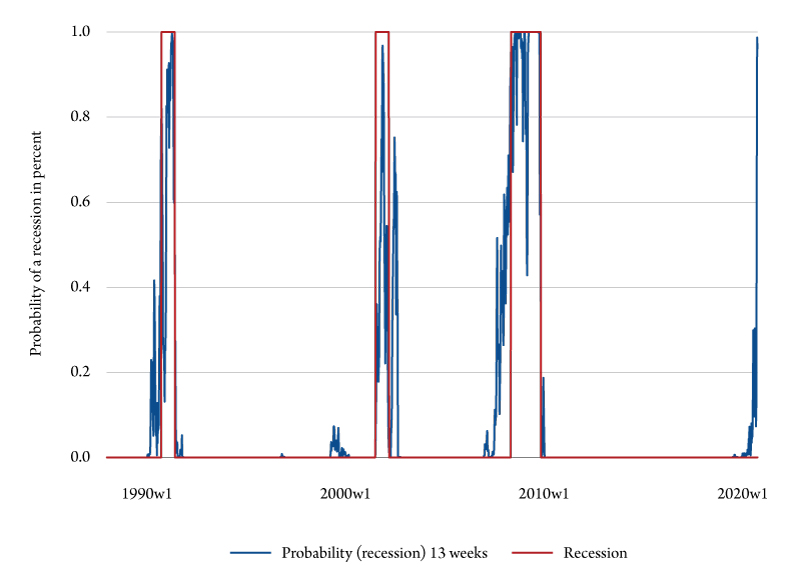
As the figures show, the probability is increasing as we move forward in time. The estimates show that there is approximately a 58.1 percent chance of recession in eight weeks (the beginning of May). That increases to 97.1 percent in 13 weeks (June) and 88.7 percent in September. These estimates are in line with other estimates. Bloomberg Economics’ estimates the probability of a recession happening within 12 months to be 52.8 percent and JPMorgan forecasts a recession by July.
Economic Policy
The goal of stabilization policy is to “right the economic ship” in adverse economic conditions. The caveat is that most policy is better suited to demand-side rather than supply-side shocks. In a demand-side recession, inflation slows and output falls. By injecting stimulus into the economy, policymakers can mitigate the effects of the downturn by increasing demand for goods and services without worrying about inflation.
Stabilization policy takes two basic forms: monetary and fiscal. Monetary policy is conducted by the Federal Reserve by raising and lowering the interbank target interest rate, called the federal funds rate (FFR). In a surprise move, between March 3 and March 15, 2020, the Fed reduced the FFR to 0% in an effort to provide assurance that policymakers were going to work at offsetting negative demand shocks and a stock market in free fall. This effort was largely unsuccessful. On March 12, the Fed announced another round of quantitative easing (QE) by buying up to a $1.5 trillion in bonds to stabilize financial markets. On March 15, the Fed reduced the FFR to 0 – .25% and will buy at least $700 billion in government and mortgage-backed bonds.
Over the same weekend, the House of Representatives passed HR 6201, the Families First Coronavirus Response Act, by a vote of 363 to 40. An initial proposal to provide payroll tax relief was rejected because it would not help those who need it the most – those who are technically employed, but ill or under quarantine, and cannot work from home.
The bill contains a variety of economic support measures, so called “automatic stabilizers” – 14 days of paid sick leave and food aid, which is essentially an extension of unemployment insurance. The package also includes free COVID-19 testing, federal funding for Medicaid, and small business tax credits.
At the time of this writing, no price tag has been attached to this package, but it will be costly. However, there is a silver lining, government bond yields are so low that the Feds can effectively borrow at 0 percent interest to finance the level of fiscal stimulus required – which could be substantial. On March 17, a $850 billion package was announced.
Conclusion
There is no telling how severe the C-19 recession will be. Recent guesstimates put second quarter economic growth in the –5 to –10 percent range. It goes without saying it has disrupted the normal flow of economic activity in structurally different ways to the 2008 financial crisis. There is also speculation that this recession will lead to another financial crisis, though not of the same ilk as the last one.
Today, banks are better capitalized, household debt burdens are lower, and personal savings are higher. However, the perfectly rational response that people stay quarantined will have considerable demand effects in the short run, but once the quarantine is over, pent-up demand will get the economy moving again. We just need to help households and small businesses weather the immediate challenges.