The U.S. economy continues to move into positive territory. For the first quarter of 2019, real GDP in 2012 prices was about $18.9 trillion after a healthy year-on-year growth of 3.2 percent. Plus, the national unemployment rate is at a near historic low of 3.6 percent, about 1 percent below the Congressional Budget Office’s estimated level of full employment. We are also experiencing an extraordinary period of stable and low inflation.
Figure 1 shows both the unemployment rate and inflation using the price of consumer expenditures without food and energy (core inflation), which is the preferred price index by the Federal Reserve.
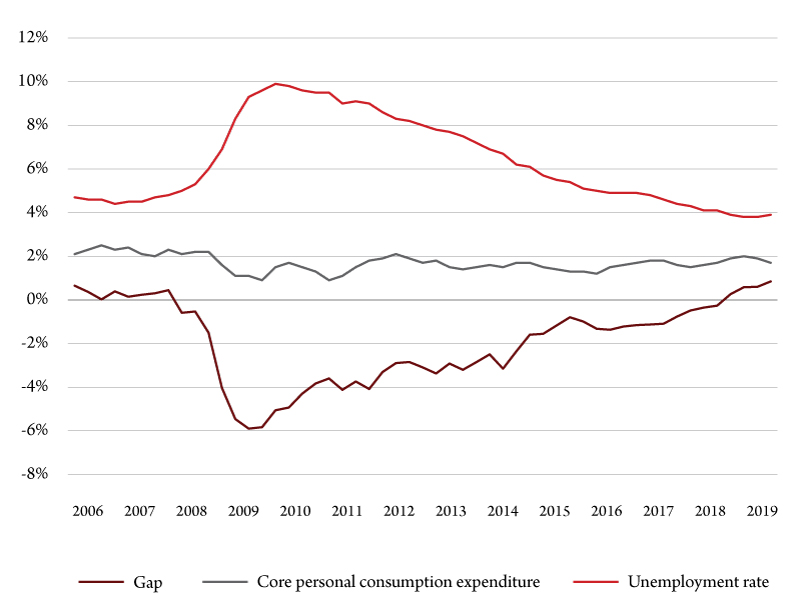
There appears to be little relationship between the two series. This is notable because until recently policymakers based their decisions on the negative relationship between inflation and unemployment. In economics, the Phillips Curve states that inflation and unemployment have a stable and inverse relationship. For instance, if inflation gets too high, the Fed will put the brakes on the economy by raising interest rates, but at the cost of higher unemployment or vice versa.
However, the weakening of the Phillips relationship does give the Fed more flexibility in terms of policy decisions. This is partially due to average labor costs and productivity, which have remained low and steady since the end of the Great Recession, keeping inflation in check.
The growth of wages leveled off between 2013 and 2015, growing at 1 percent after an average growth rate of zero percent from 1987 to 2011. The argument for the Phillips Curve is that as unemployment gets lower, firms must offer higher wages to either entice potential employees into the labor force or to attract higher quality labor from other employers.
But the labor market may not be as tight as statistics suggest. U6 unemployment, which includes discouraged workers, marginally attached workers and workers who work part time but want to work full time, remains above 7 percent.
The output gap is defined as the percentage difference between current real GDP and potential long run real GDP. It currently sits at 0.85 percent. One of the primary reasons for this is the Tax Cuts and Jobs Act, which was passed in 2017, a Keynesian stimulus deficit spending package. This is the type of policy required when an economy is experiencing a recession to reduce unemployment and generate some inflation.
Since the end of 2018, government expenditures have been rising at an average annualized quarterly growth rate of 5 percent, whereas receipts have been rising at 0.5 percent. This has yielded a growing budget deficit. By the end of fiscal year 2019, the Congressional Budget Office predicts the deficit to be $1.1 trillion and $1.3 trillion by 2029.
The Tax Cuts and Jobs Act was intended to increase corporate investment in new capital, which in turn would result in more hiring. But as we have seen, at the time the law was signed unemployment was at its lowest since the end of 2000. So there is little reason to believe that unemployment can go much lower, which it really has not. Since the start of 2018, the unemployment rate has been between 3.6 and 4.1 percent.
An unfortunate side effect of deficit spending is twofold. First, according to the Office of Management and Budget, the deficit in 2019 will be almost $400 billion, which is 8 percent of the total budget. This is forecasted to grow to $760 billion by 2026, eating up 13 percent of the budget. Thus, a growing percentage of the budget is being used to service debt and not on the very real issues facing our country, such as climate change, student debt, health care or social security.
Second, since 1980 the U.S. economy has been stricken by five recessions. During each of those recessions the deficit was less than 3 percent of GDP – the exception being the 1 percent budget surplus in 2000. Currently the deficit is below 4 percent of GDP and rising.
By 2039, the Congressional Budget Office projects the deficit to be about 9 percent of GDP, which is where it was after the massive Recovery Act that was designed to pull the U.S. out of the worst recession since 1929. This forecast assumes government spending will remain at current levels as will taxes.
Alternative estimates suggest the deficit could reach the 9 percent level by 2027. This implies that when the next recession hits, the federal government may be less willing or able to fight back. And if the government can’t, won’t or starts to renege on its debt, interest rates will rise.
More uncertainties lie in the disruptions caused by the Trump administration’s trade policy. In 2018, the Tax Foundation estimated that the first round of tariffs on imported goods from China, Mexico, Canada would cost the U.S. about a half-million jobs from retaliation and higher imported intermediate goods, such as steel. Rough estimates from the first round of tariffs have estimated U.S. losses of three to five jobs per one job saved.

The tariffs are not only resulting in job losses – the agriculture sector in particular is suffering from retaliatory tariffs. According to Wisconsin Sen. Tammy Baldwin (R), Chinese retaliatory tariffs have contributed to 1,500 bankruptcies in the dairy industry – 90 in April alone. The government has provided nearly $30 billion in aid to farmers to compensate them for lost revenues.
Unfortunately, it is American households who are paying for this. According to economists from the Federal Reserve, Princeton and Columbia, American families are paying nearly 100 percent of the tariffs in the form of higher prices. The aid package to farmers is paid for by U.S. taxpayers as well.
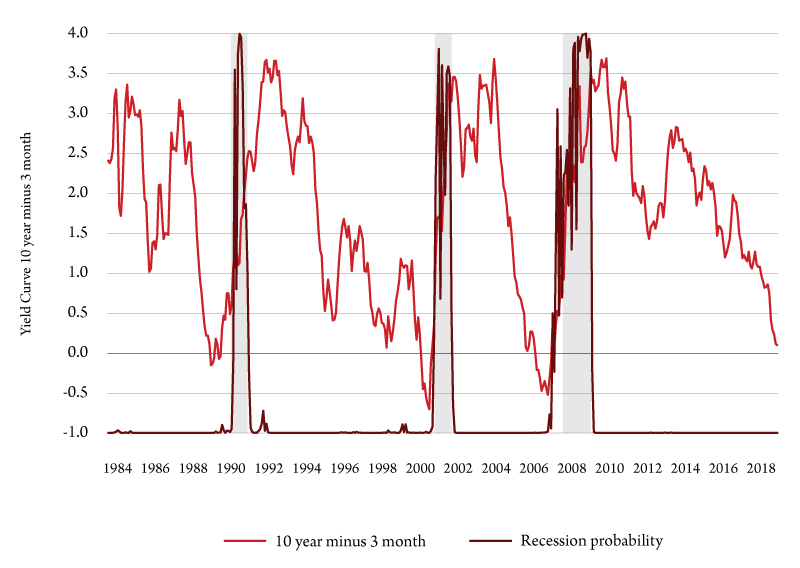
Fortunately, this is not likely to throw the U.S. economy into a recession and we predict no recession over the next 12 to 16 months (Figure 2).
Montana
Because the U.S. economic performance represents aggregate state economic outcomes, state economies are somewhat more unstable. Figure 3 shows Montana’s output gap. Unlike the country as a whole, there is no government estimate for the potential GDP at the state level.
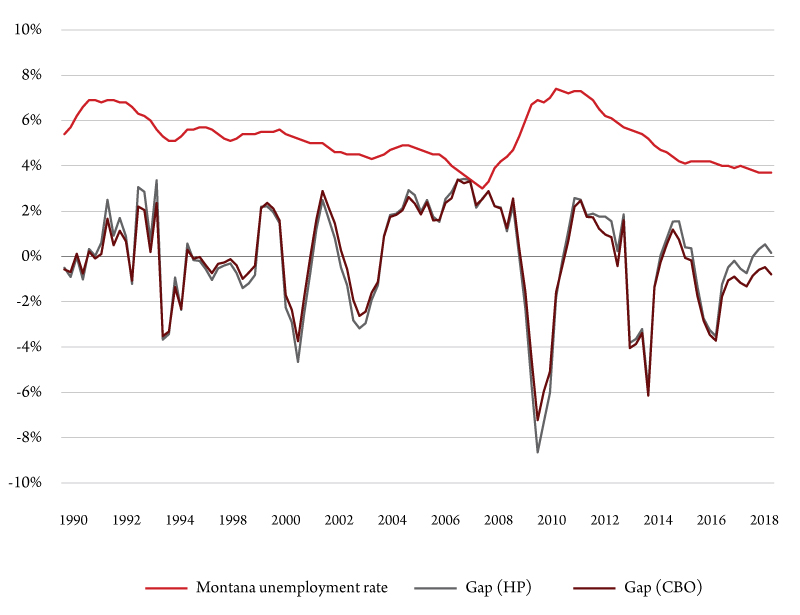
This figure allows us to approximate recession dates for the state. Following the Great Recession, Montana appears to have survived two additional recessions – one in 2012-14 and again in 2016. The biggest drivers of these two downturns were natural resources, both agriculture and mineral extraction. Part of this can be explained by lower prices in agricultural output and coal around 2012, and lower gas and oil prices between 2015 and 2016. Manufacturing also declined in 2015 and 2016.
Meanwhile overall unemployment in the state has remained the same since 2015. Population and nonfarm employment have been growing at the same rate and it’s likely that the unemployment rate is at or near it’s long run trend – estimated to be between 3.5 percent and 4 percent.
Summary
Are we experiencing the calm before the storm? It is still too early to know. Labor markets remain healthy in terms of the number of jobs. Unemployment claims continue to fall and hiring rates are above quit rates. Stock markets and fear indices continue to shrug off policy shocks and consumer confidence is rising, contrary to what is happening in Japan and Europe.
But there are some storms clouds forming over the horizon – wealth, health and education inequality in the U.S. is stirring economic discord. The probability of a European recession is rising and the effects of the ongoing trade dispute will fully manifest over the next year or so, if the current state of affairs continues.