
There have been a number of reports, mostly in the media, describing how rural timber-dependent communities are faring in the wake of a decades-long decline in employment and mill closings. Stories often highlight a new industry that’s sprouted in its place or a new plant that’s opened and filled the gap. One example from Washington comes from the town of Leavenworth, which has been highlighted as changing from a timber town to a Bavarian Alps-styled tourist destination.
In Idaho, wood products employment has decreased by roughly 6,200 jobs since 1998 (nearly 23 percent). Many of those jobs losses were particularly hard on rural areas with few alternative employment opportunities.
Headwaters Economics of Bozeman, Montana, recently concluded that, “As a group, formerly timber-dependent counties are not doing better or worse than the rest of the West.” They also noted, “We found no statistically significant differences between timber and non-timber counties according to five measures of socioeconomic performance.”
Unfortunately, these conclusions are not true as rural timber-dependent counties in Idaho have suffered significantly. An impact analysis comes to a very different conclusion – there have been sizable losses and these timber-dependent counties have not grown as rapidly as other communities.
The Headwaters Economics Analysis
The Headwaters Economics report on “The Transition from Western Timber Dependence: Lessons for Counties” begins by presenting trends in the timber-related industries from 1970 to 2015. It uses inflation-adjusted labor earnings in 11 western states (Arizona, California, Colorado, Idaho, Montana, Nevada, New Mexico, Oregon, Utah, Washington and Wyoming). Using this measure, the size of the timber-related industry decreased by almost one-half during this 45-year period.
Headwaters Economics identified 25 historically timber-dependent counties in these western states – counties where timber-related jobs accounted for 20 percent or more of labor earnings between 1970 and 1989. These counties are located in five western states (Montana, Idaho, Washington, Oregon and California).
In comparing these counties with other counties in the West with populations of less than 200,000, they concluded that there was no statistical difference between them. They also concluded that the timber-dependent counties had successfully transitioned away from being dominated by one industry.
The Wrong Variables and Statistical Tests
Headwaters Economics compared traditionally timber-dependent counties and the other counties using data for five variables:
- Population change from 2000 to 2015.
- Average wages across all sectors.
- Median household income in 2015.
- Percent of adults with a college degree in 2015.
- Percent of families in poverty in 2015.
While these variables may be slightly related to certain economic activities, they are not indicators of regional economic performance. None of them measure the size of the regional economy or its growth. They are also not related to the production of goods and services in a region as the variables measure neither inputs nor outputs of economic activity. Therefore, they are not appropriate tests to measure the differences in economic growth between counties.
In addition, when comparing timber-dependent and non-timber dependent counties, Headwaters Economics used indicators that were reported in terms of their medians rather than means. But the statistical tests for means are very different from those appropriate of medians. In other words, the statistical tests they used are appropriate for parametric statistics (means) but not appropriate for non-parametric statistics (medians). In short, their conclusions were incorrect.
Economic Impacts of Wood Products Declines in Idaho
Just as problematic was the misuse of the concept of economic impact analysis. An economic impact analysis typically measures or estimates the change in economic activity between two scenarios, one assuming the economic event occurs and one assuming it does not occur, which is referred to as the counterfactual case (or potential).
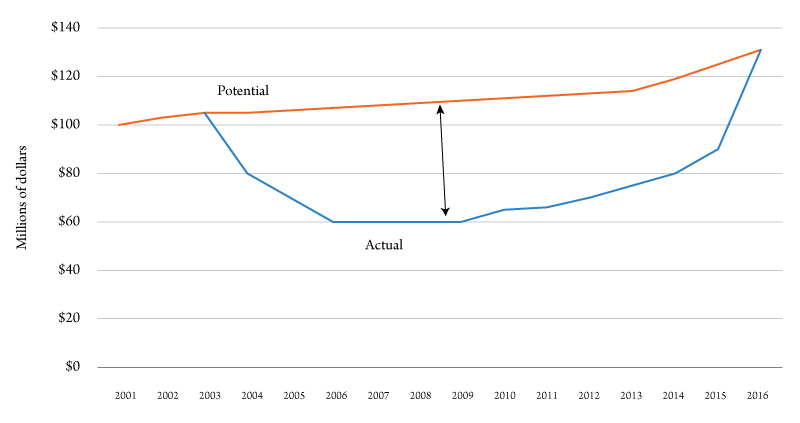
An economic impact analysis, which follows this approach, can be illustrated by constructing an example for a hypothetical timber dependent county. Figure 1 presents an example of labor income in a hypothetical county from 2001 to 2016. These data portray labor income growing from 2001 to 2003. Then a negative event, perhaps a plant closure, occurs in 2003. Labor income turns downward in 2004 and declines until 2006, as the impacts are felt throughout the economy. The economy stabilizes from 2006 to 2010, then turns upward and begins to grow in 2010, accelerating during 2015 and 2016.
The potential data shows what would have happened if the negative event did not occur. In this case, the economy would have continued to grow at the historic rate and then accelerate in 2015 and 2016. The economic impact of the negative event is the difference between the potential and the actual lines.
Figure 1 illustrates some very important features of an economic impact analysis:
- Economic impacts are not a single number; they have a time dimension. There are negative economic impacts for as long as the actual data lie below the counterfactual.
- Stability in an economy after a negative impact does not mean the negative impacts are over.
- A return to growth does not mean the negative impacts are over, even if the economy accelerates and grows the same rate or faster than the counterfactual (2015 and 2016).
- A return to pre-event levels (e.g. 100) does not mean the negative impacts are over, as this does not consider the growth that would have occurred anyway.
- A return to the previous trend (the actual line catches up to the counterfactual) does not eliminate the negative impacts. The lower levels of economic activity from 2003 to 2015 remain on the books.
Following Headwater’s approach and using the above guidelines, the economic conditions in Idaho’s timber-dependent counties were compared to those for other non-urban counties in the state from 2001 to 2016. The timber-dependent counties identified by Headwaters Economics were Benewah, Bonner, Clearwater, Gem and Idaho counties. The actual performance of the timber counties was measured using inflation adjusted nonfarm earnings as reported by the U.S. Bureau of Economic Analysis.
The hypothetical values denoted as potential were calculated as nonfarm earnings if the timber counties had performed the same as other non-urban counties in Idaho. In other words, starting with actual nonfarm earnings in 2001, values for subsequent years were calculated by applying the growth rates for the non-urban counties in Idaho.
Figure 2 presents the five historically timber-dependent counties in Idaho taken as a group. The figures show that actual and potential nonfarm earnings had very similar trends from 2001 to 2007. Then actual nonfarm earnings turned sharply downward while potential nonfarm earnings declined more slowly. Actual nonfarm earnings reached a trough in 2011 and turned upward starting in 2012. The negative economic impact is shown by the difference between the two lines.
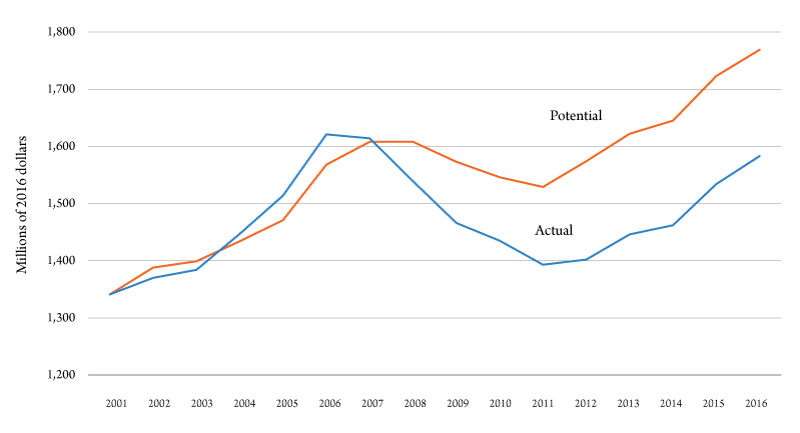
If there were no differences between these groups, as Headwaters Economics claims, the actual and potential lines would coincide and there would be no economic impact. But this was not an ordinary business cycle for the wood products industry. A large number of major sawmills and other wood products firms closed and their equipment was dismantled. These facilities would not reopen when the economy recovered after the Great Recession. About 20 Idaho sawmills, and plywood and veneer plants closed between 2001 and 2016.
In addition to the calculations for the timber-dependent counties as a group, a similar analysis was conducted on a county-by-county basis. Significant negative impacts began to appear about 2008 and continued until 2016 for six of the seven counties reported.
The negative impacts reached double-digit levels for several years in all six counties. In Bonner and Gem counties, the negative impacts reached a peak and began to moderate somewhat by 2016. The negative impacts continued to increase during the entire period in Clearwater and Idaho counties. In Benewah and Nez Perce counties, the negative impacts stabilized during the last few years.
The computed impacts for Boundary County were relatively small and both positive and negative. Boundary County borders Canada with two ports of entry. Further investigation revealed that the earnings for federal government employees more than doubled between 2001 and 2016, perhaps reflecting increased border security measures. Recomputing impacts for nonfarm earnings without the federal government may yield larger negative impacts.
The relative size of the negative economic impacts differs from one county to another. Overall, Clearwater County reported some of the largest computed impacts while Gem County reported the smallest. Regardless of their size, these negative impacts may be interpreted as saying, for example, that nonfarm earnings in Clearwater County would have been almost 19 percent higher in 2016 if that county had grown at the same rate as other non-metro counties in Idaho.
Summary
Headwaters Economics concluded there is no statistical difference between the 25 most timber-dependent counties in the West and other rural counties. This conclusion is incorrect because they analyzed the wrong variables and used the wrong statistical test.
An impact analysis following accepted methods of the five timber-dependent counties in Idaho came to very different conclusions. Namely, inflation-adjusted nonfarm earnings in these counties as a group would have been about 11 percent higher in 2016 if they had grown at the same rate as other non-metro counties in Idaho. A county-by-county analysis reached a similar conclusion. In six of the seven counties (five identified by Headwaters Economics, plus two others) the timber-dependent counties grew slower than the other non-metro counties in Idaho. The only transition for these timber-dependent counties was to a smaller economy.