
After weeks of bad news, on June 5, the Bureau of Labor Statistics published its May employment situation summary. For businesses, policymakers and economists it was one of the most anticipated employment reports in recent history. Given dismal labor statistics, such as the 43 million initial claims for unemployment insurance since March 21, most economists believed the unemployment rate would rise to over 20 percent. Instead, the data released had completely unexpected results.
During May, the U.S. economy created, though it is probably safer to say rehired, 2.5 million workers. This pushed the unemployment rate down from 14.7 percent to 13.3 percent. Though this statistic has a caveat. A note in the release states:
“If the workers who were recorded as employed, but absent from work due to other reasons (over and above the number absent for other reasons in a typical May) had been classified as unemployed on temporary layoff, the overall unemployment rate would have been about 3 percentage points higher than reported.”
That is the unemployment rate should have been 16.3 percent.
But during these uncertain times nothing is as it seems. Over the past three months a torrent of extraordinary events has occurred in the national and global economy. Just as epidemiologists, immunologists, geneticists and other medical professional are trying to understand the SARS-CoV-2 virus (coronavirus) and the associated COVID-19 disease, economists are also trying to analyze the impacts of the virus and resulting policy that has been introduced by this pandemic.
The timeline of the current pandemic is well-known. Sometime in January, the virus entered the country from China on the West Coast and roughly the same time a strain entered the country from Europe on the East Coast after hitting China and Southeast Asia. To contain the virus draconian measures were implemented globally.
In a recent paper, Solomon Hsiang of the Global Policy Laboratory and Goldman School of Public Policy at the University of California, Berkeley, estimated the impact of containment measures on the spread of the coronavirus. Hsiang and his co-authors estimated that the measures implemented may have averted up to 530 million infections globally. The death rate of COVID-19 has been estimated to be about 1.3 percent, which implies that 6.9 million lives have been saved by the measures. According to Hsiang, the policies that led to the biggest reduction in infection were social distancing, home isolation and business closure. These reduced infection rates by 25 percent, 12 precent and 6 percent respectively. Of course, these measures had an appreciable negative impact on the economy.
Economic Fallout
The general lack of testing, contact tracing and individual self-quarantine, as well as the slow response and misinformation about what was to become a global pandemic, meant that any form of policy would have to be a very blunt instrument. What was required to prevent a highly communicable disease from spreading was to isolate individuals.
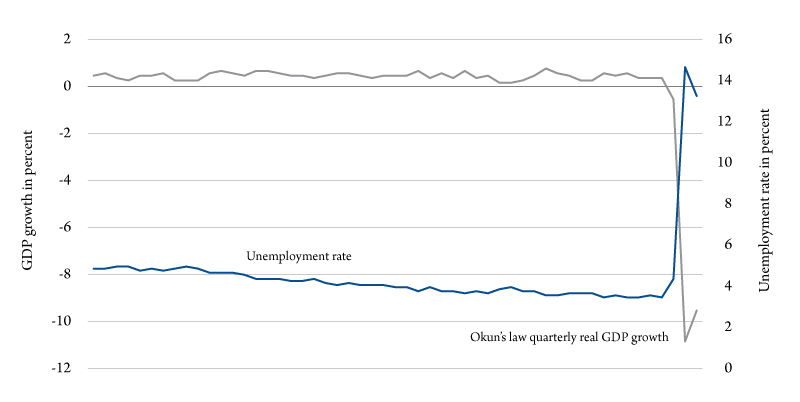
The timeliest data available to judge the pain felt in the real economy is the unemployment rate. Using Okun’s law (the relationship between unemployment and losses in a country’s production), we can guesstimate quarterly real GDP growth rates using monthly unemployment data. Figure 1 shows the monthly unemployment rate and the associated Okun’s law GDP growth rate. According to this calculation, current monthly real GDP is shrinking about 9 percent per quarter, which is on par with other estimates. This corresponds to the current official unemployment rate of 13.3 percent.
But a slightly deeper dive into the data has other revelations. First, let’s consider gender unemployment rates. For the first time since 1980, the unemployment rate for women is higher than men (Figure 2). In April and May, women’s unemployment was about 2 percentage points higher than for men. This reflects the types of industries that males and females are employed in and because women are generally more responsible for child care. For example, retail is largely female dominated.
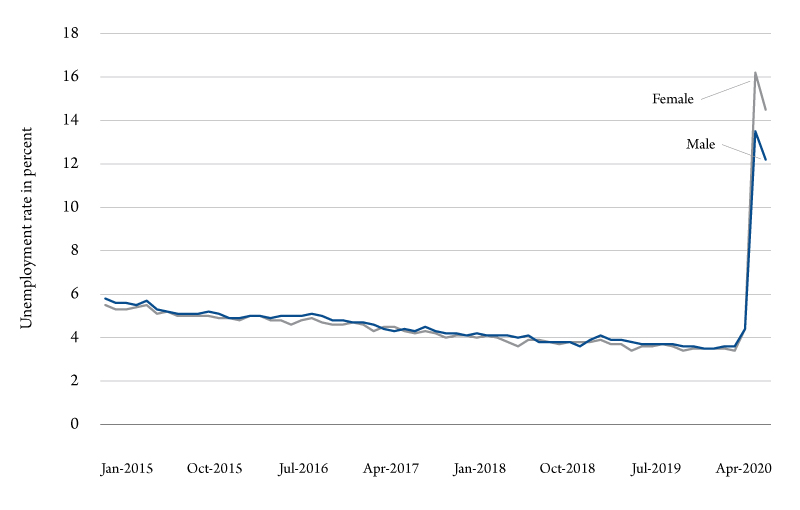
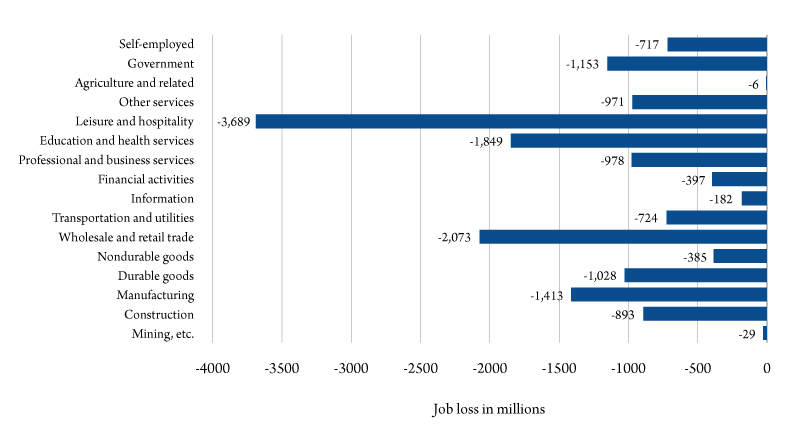
Figure 3 shows the total job losses by sector from May 2019 to May 2020. The most impacted sectors are leisure and hospitality, health and education, wholesale and retail trade, and manufacturing. Recall that manufacturing continues to be affected by the trade war between the U.S. and China. In previous recessions, male-dominate jobs, especially in construction and heavy manufacturing, were hit the hardest.
Recent turbulence in real economic activity has generated unprecedented changes in individual markets for goods and financial instruments. Perhaps the most striking example are oil prices, which were negative for a day. Declining demand for oil distillates and a mini-price war between Saudi Arabia and Russia resulted in such a glut of oil in international markets that producers were paying market participants to store the oil. At the closing bell on April 20, oil prices were –$37.98/bbl before recovering to $8.91 the following day.
Reopening the Economy
April is when individual states started announcing dates for reopening the economy – most in phases. According to experts, only six states have met the minimum requirements to fully open a state economy. The requirements include, a sustained two-week drop in cases; a low number of daily cases; high testing capacity; less than 5 percent positive tests; and high health care capacity.
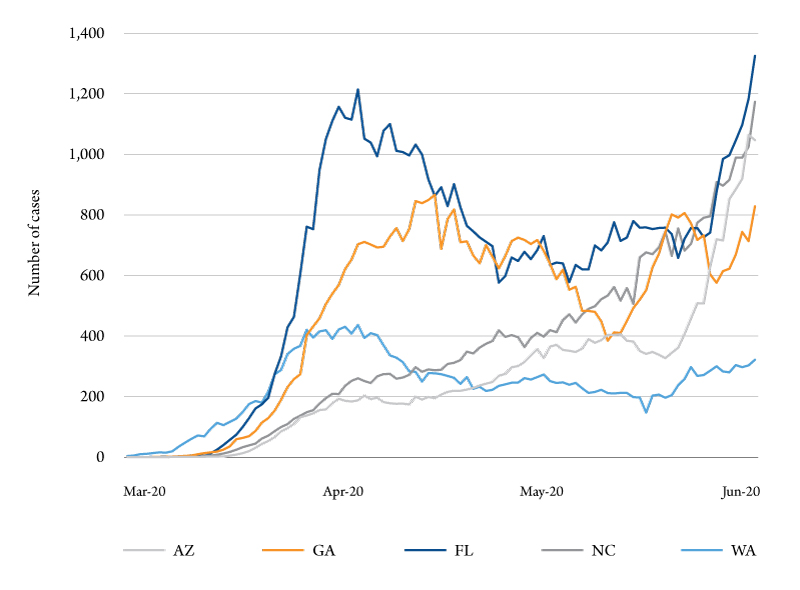
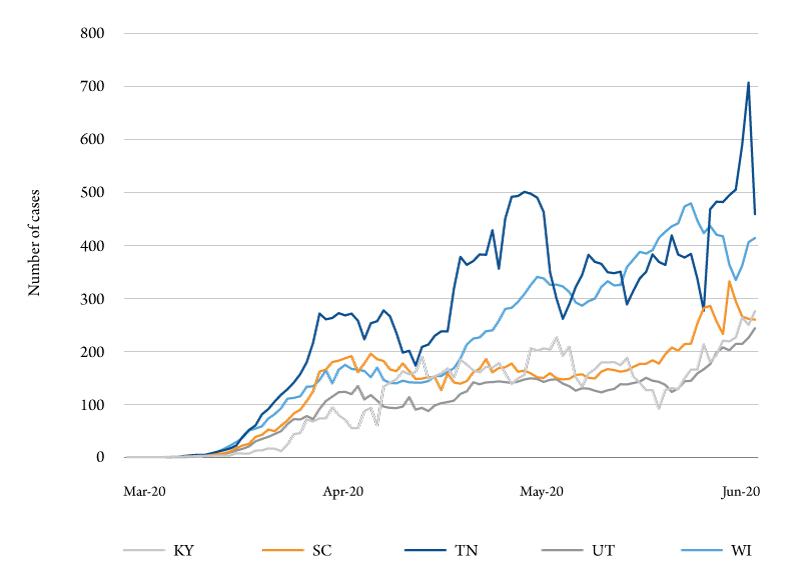
Figure 4a-b show the seven-day moving average of new daily coronavirus cases for 10 states from March 20 to June 7. As the figures show, some states have a “w” shape in new cases, such as Florida, Georgia and Tennessee. Florida, in particular, is problematic. New cases are growing faster than in the initial stages of the pandemic – reaching almost 1,400 new cases per day in early June. Perhaps more alarming are the new case counts in North Carolina and Arizona, and to a lesser extent Kentucky, Wisconsin and Utah. These states are only now being affected.
Not all states follow this pattern, but for these states we can already see the echo of being too aggressive in opening their economies. We can also see this in real time data, such as reservations made using OpenTable (an online restaurant-reservation service app). Figure 5 shows the percent difference in reservations made from 2019 to 2020 for the same five states shown in Figure 4a. The three states that have more aggressively opened their economies are the same three states with the fastest rising new cases.
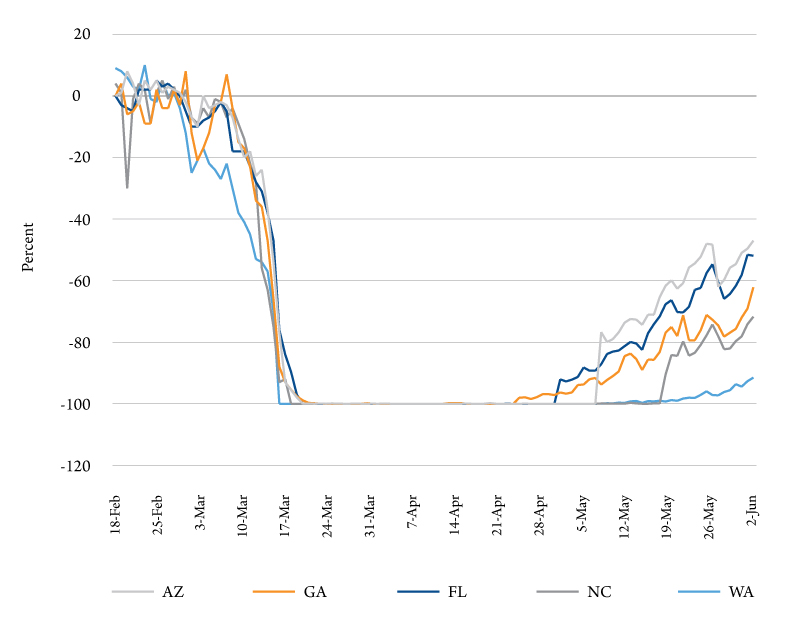
It is interesting to compare Washington with Florida or Georgia. If you look at the reservation data, Washington reservations are down about 90 percent from 2019 levels, whereas Florida is 50 percent lower. On June 7, Washington had about 300 new cases, while Florida was four times higher.
This observation raises an obvious question. Did the rise in cases cause the decline in economic activity proxied by reservations or vice versa? Statistical analysis reveals that both are true. The decline in economic activity has had a statistically significant impact on cases.
Both financial markets and individuals are reacting to short-run conditions. From the household perspective, the success of social distancing has given individuals a false sense of normality, particularly those states that were not hit hard in the first wave of the virus. This is referred to as the “prevention paradox.” Given the success of isolation, there is a perception that the pandemic is not extreme, so drastic measures need not be taken.
From the most recent data, it appears that opening the economy will lead to more cases and the potential need to shut down the economy again. However, should that need arise in the months ahead the results will likely not be as dramatic. While a vaccine will not be publicly available for upward of a year, testing and contact tracing has improved.
One potential hiccup that requires further discussion is the source of the economic decline. Policy and discussion has focused on demand side impacts. But there are also severe supply side negative shocks, as witnessed by the market movements in commodities. Experts suggest that over half the decline in output in the first five months of 2020 were due to supply side effects.
Summary
The COVID-19 pandemic will be the subject of countless research papers and dissertations for years to come. This is a once-in-a-lifetime event on a global scale that will require global solutions. The disease continues to spread to the Southern Hemisphere and other less developed countries.
The acceleration of known cases in Russia and Brazil are alarming. At current growth levels Russia and Brazil will have over 800,000 and 1 million cases respectively by the first week of July. The growth in the virus outside our borders will ricochet back, but with newer mutated versions.
Epidemiologists foresee three possible scenarios. The first is small waves of outbreaks, following the initial outbreak. The second is a redux of the Spanish flu (1918 flu pandemic) where the initial outbreak was followed by a brief intermission, which proceeded a larger second outbreak, and then a series of outbreak waves. The last scenario could be called the “Groundhog Day” scenario, where history repeats itself.
Whatever economic structure that exists after this pandemic will be one where we must internalize the disease, perhaps for years to come. This will require serious discussions about every aspect of life from child care and education, to defense and international relations.