From the Editor: In 1972, the state of Montana legalized a variety of gambling games, including bingo, raffles, poker and other card games. In 1997, the Montana Legislature appointed the Montana Gambling Study Commission to conduct research and make public policy recommendations. The following article is an excerpt from an extensive survey conducted by the Bureau of Business and Economic Research in 1998.
Montana’s current legal gambling environment has evolved from a long tradition, dating back to the free-wheeling mining and logging camps of the last century. In the late 1800s card games and other sorts of gambling were a way to pass time for cowboys, deputies, gunfighters and other rugged Wild West types. Not all of them were as unfortunate as Wild Bill Hickok, though. Wild Bill met his end at a card game in 1876. The sharp-shooting marshal, who claimed to have killed hundreds of men, never even had the chance to draw his two ivory-handled Navy Colts that helped him earn the reputation of the toughest gunfighter in the West.
Today, gambling is a little more civilized. People don’t usually get shot over a bad hand or bad debt, as they sometimes did in the frontier days. (In Wild Bill’s case it was over numerous previous disputes.) And nowadays, gamblers are more likely to play video gambling machines instead of card games. Furthermore, gambling today is a major industry. In 1996, U.S. residents spent $47 billion on gambling.
Montanans spent more than $239 million on gambling last year, mostly on video poker and keno machines. Interestingly, Montana was the first state to legalize video gambling in bars.
Montana gambling establishments make substantial contributions to local businesses and to the state’s tax base. However, gambling has been a controversial activity in Montana and other states for a long time. Many individuals and groups oppose gambling on moral and social grounds.
Gambling in Montana currently consists of commercial/charitable gambling, lottery products and pari-mutuel wagering on horses and dogs. Lottery products are sold by retailers statewide. Video gambling machines (VGMs), live keno-bingo and card games are offered by establishments licensed by the state. Individual establishments may operate no more than 20 VGMs, with each machine awarding prizes of up to $800 per game. Montana gambling establishments do not offer slot machines or table games, such as blackjack, roulette or craps.
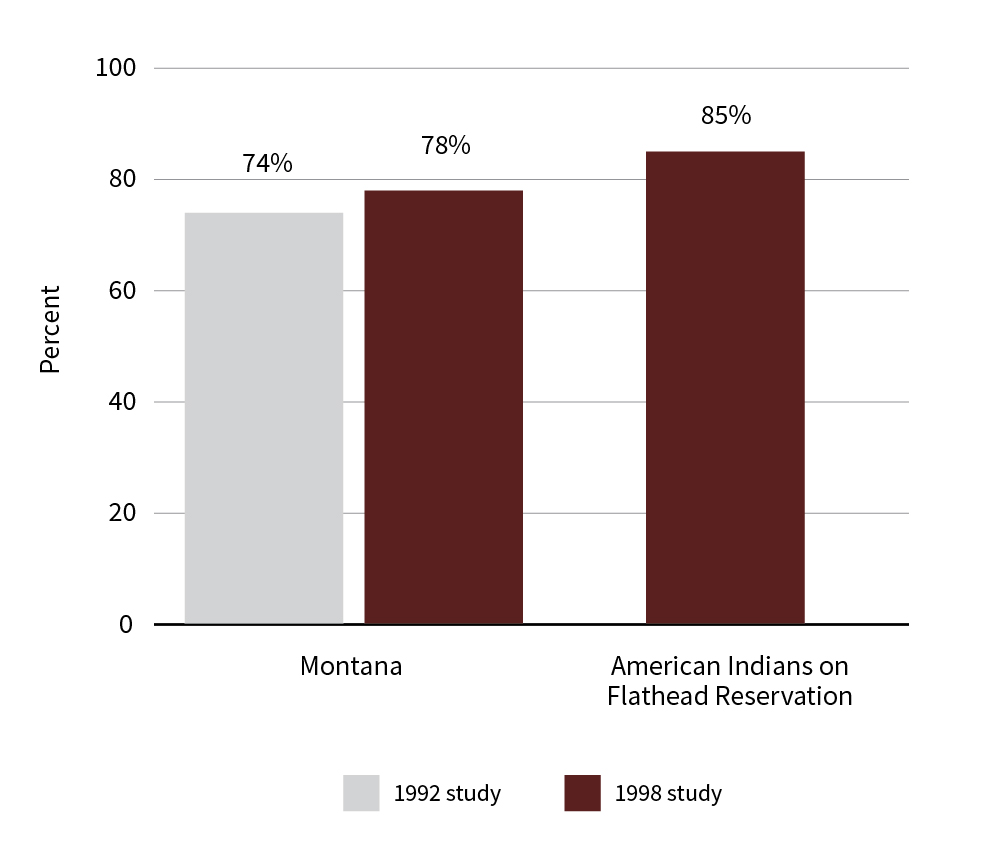
Roughly 78 percent of Montana adults reported gambling in the past year. Among American Indians on the Flathead Reservation, the corresponding figure was approximately 85 percent (Figure 1).
Montana is unusual in that gamblers are evenly split between males and females. About 51.5 percent of those who reported gambling in the past year are males, which is statistically indistinguishable from the 48.5 percent of gamblers who are female.
Recent research suggests that there are few differences between men and women in gambling frequency and wagering levels. However, the scope of women’s gambling – the number of different types of gambling in which women participate – is significantly narrower than the scope of men’s gambling.
Montanans receiving income from Social Security have a lower gambling participate rate than those not receiving Social Security income. Montanans receiving public assistance have about the same gambling participating rate as those not receiving public assistance.
About 23,400 Montanans are problem gamblers. Of those, about 10,400 (+/- 4,500) are past year probable pathological gamblers. Roughly 13,000 (+/- 5,200) are in the less severe classification of past year problem gamblers.
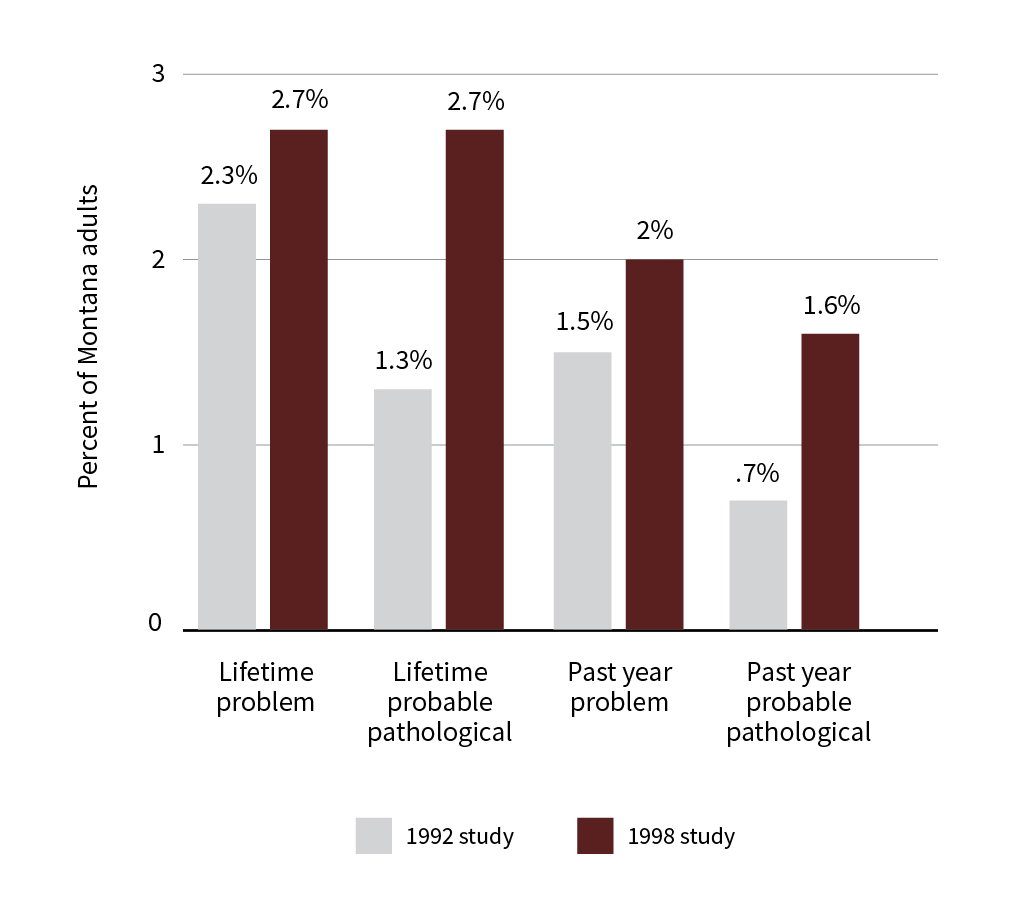
Montana problem gambler rates rose between the 1992 and 1998 studies. Yet, Montana’s overall problem gambling rate is similar to other states, as is the increase. Montana’s American Indians have higher problem gambler rates than the overall population. As shown in Figure 2, past year probable pathological gamblers accounted for about 1.6 percent of Montana’s 1997 adult population, up from .7 percent reported in the 1992 study. Past year problem gamblers were about 2 percent of Montana adults in 1997, an increase from 1.5 percent reported in the 1992 study. Similarly, the lifetime probable pathological rate rose from 1.3 percent to 2.7 percent between the two studies and the corresponding figures for lifetime problem gamblers were 2.3 percent and 2.7 percent, respectively.
Montana problem gamblers prefer VGMs, lottery products (e.g. Powerball) and scratch tickets – all activities with rapid play cycles and immediate replay opportunities. This preference has also been reported in studies of problem gamblers in other states. About 48 percent of Montana past year problem and probable pathological gamblers reported that they play VGMs on a weekly basis, while only 8 percent of the non-problem gamblers gave a similar response. About 20 percent of the problem and probable pathological gamblers purchased a lottery product once a week or more, compared to 2 percent of non-problem gamblers.
Only a few distinguishing characteristics emerge from an examination of Montana problem gamblers’ profiles:
- Montana problem or probable pathological gamblers are equally likely to be male or female (in other states, more are male).
- Educational attainment of problem gamblers is lower.
- Thirty percent of problem gamblers are over 50 years of age vs. 17 percent reported in the 1992 study.
- Problem gamblers are more likely to be divorced or separated.
What does the relative lack of distinguishing characteristics mean? It suggests that with the exception of American Indians and seniors, services for problem gamblers should be targeted broadly rather than at specific risk groups in the population. It also might be appropriate to target court staff, as well as marital and family counselors, because of the negative impacts gambling has on families and the ever-growing divorce rate of gamblers. In 1998, 29 percent of problem and pathological gamblers were divorced (vs. 12.9 percent in the total population).
From convenience stores to casinos, Montana’s gambling industry has grown at a phenomenal rate over the past several years. With the data in hand, Montanans now face tough policy decisions regarding the state’s gambling industry. Should the number of video gaming machines be more tightly controlled? Should new games such as blackjack be introduced at destination resorts? How about riverboat gambling on the Missouri, Yellowstone or Clark Fork rivers? Are Montana’s gambling taxes adequate? Who pays the social cost of gambling? These and other questions need answering.
In 1998, Paul E. Polzin was director of the Bureau of Business and Economic Research, John Baldridge was a public policy analyst, Daniel Doyle was a University of Montana professor of sociology and James T. Sylvester was a BBER economist. Rachel A. Volberg was president of Gemini Research, Ltd., and W. Lamar Moore was the operations manager.