There has always been a lot of confusion in discussions about tax revenues in Helena. More accurately, there is confusion when these discussions circulate outside the political community in our state capital. Most of the confusion centers around language. A spending “cut” in budget speak usually means a lower rate of growth than previously planned. Revenues which grow less than forecasted are referred to as “down.” Thus, the news about revenues, which ultimately required a special legislative session last November, requires some interpretation.
The discussion of declines and shortfalls in Montana tax revenues is more than semantics. General fund revenues are extraordinarily weak. On a fiscal year basis, general fund collections – encompassing the entire suite of state taxes and fees not earmarked for specific use – managed to grow by just $20 million in 2017. On a base of $2.1 billion, that’s roughly a tenth of a percentage point growth. The first four months of the new fiscal year have been a bit better with revenues up about 2.4 percent. That’s mostly because the July-October period of 2016, which was used as a basis of comparison for this calculation, was extraordinarily weak. If we compare recent collections to two years ago, the growth is just 1 percent.
This stark reality has led to a new kind of confusion. Why aren’t revenues coming in as they should be? Behind this question is the premise that the economy is strong and thus the underperformance of revenue collections reveals a flaw in our tax system, not weakness in the base. As a matter of logic this is certainly possible, but calling a forecast right and the data wrong is not something that forecasters commonly do.
The Heart of the Matter: The Personal Income Tax
There are 32 taxes, fees and other sources of revenue that account for about 98 percent of all Montana general fund revenue. Of those, the personal income tax accounts for more than half. In some years, big swings in more volatile taxes have made general fund revenues surge and wane. But the story behind this recent sluggish revenue performance has been stagnation in the receipts of Montana’s most important tax.
Are personal income collections tracking the economy? A glance at Figure 1, which displays income tax collections and personal income for each fiscal year 2002-17 along a regression line, reveals that tracking is less than perfect. While there is a close fit between income growth and tax collections, there have been some significant departures from what you might expect at different points in history.
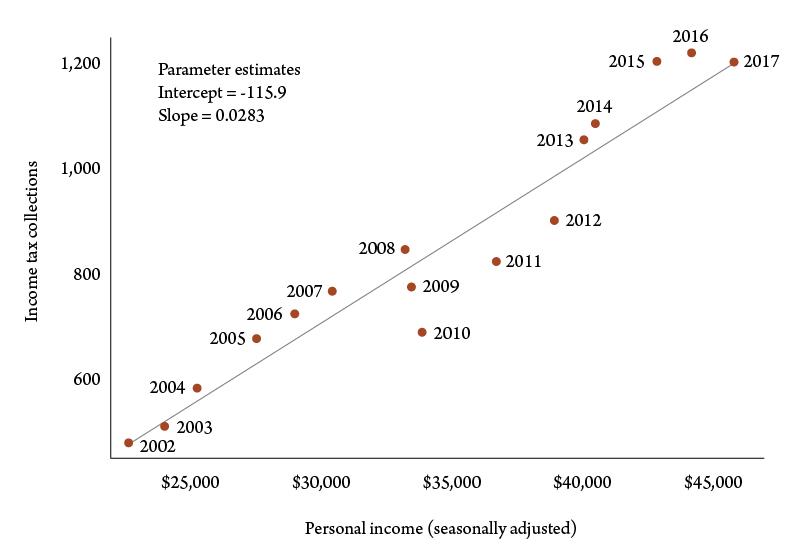
In the prerecession years of 2005-07, income tax receipts were stronger than income growth would seem to support. There was a run of errors in the opposite direction following the recession, when in 2010-12 revenues fell substantially short of what personal income growth would predict. And at the upper right edge of the graph, you can see that 2017 collections lay exactly on the line. By this measure 2017 revenues were exactly consistent with the historical relationship between taxes and the economy.
This is hardly the last word, of course. The considerable deviations from the tax/income trend relationship over recent years calls into question exactly why departures that cause revenue to over- or underperform take place. With the increasing importance of the retired population, this undoubtedly reflects the significance of taxable retirement account drawdowns, which are not considered current personal income. Also, the 2017 data on personal income are preliminary estimates, subject to future revisions that could substantially change the story told above.
The Changing Composition of Income Growth
This finding suggests that the root of the issue for personal income tax collections lies in the trends in the base. For this analysis it is preferable to deal with annual personal income data from the U.S. Bureau of Economic Analysis, rather than quarterly information, because it has already undergone some revision and is based on more complete source information. This necessitates focusing on calendar years, which do not exactly correspond to the state’s fiscal year data.
Personal income, in the main, consists of three components: 1) earnings, which is income derived from employment; 2) unearned income, consisting of dividends, interest, rent and royalties; and 3) transfer payments, which are largely payments from government programs, such as Social Security, disability or unemployment insurance. There are other pieces as well, but these are less important. Of the three, the most important is earnings, which comprises about 60 percent of the total.
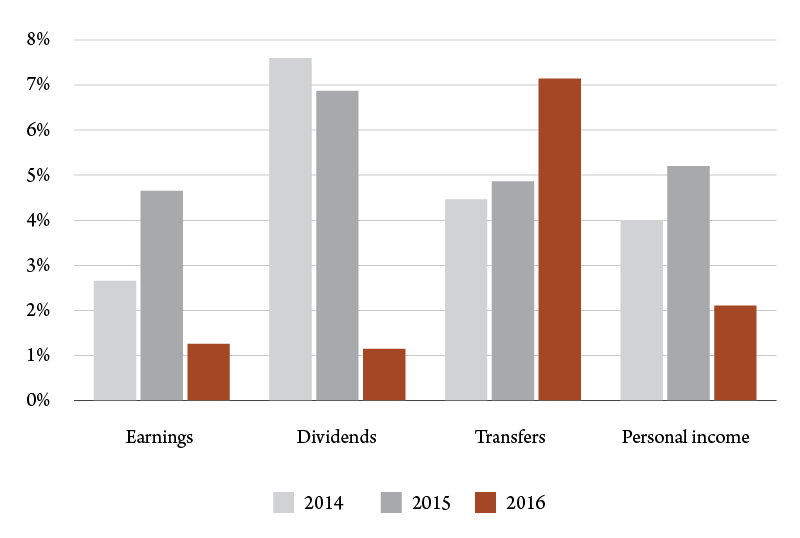
After surging in 2015, earnings growth in Montana fell to 1.2 percent in 2016 (Figure 2). There was also a steep decline in growth of unearned income in Montana in 2016 after two years of heady increases. This may reflect declines in energy-related royalty payments. Only the transfer payment category, which accounts for about 18 percent of personal income, saw a surge in growth. Many pieces of the latter category are not subject to tax. Overall, personal income growth was just 2.1 percent in 2016.
A closer look at the factors behind slow earnings growth reveals more that can explain the trends in income tax collections. Earnings can also be broken down into three components: 1) wages and salaries; 2) other labor income, consisting primarily of benefits and pension fund contributions made by employers; and 3) business proprietor income.
Of the three the largest, wages and salaries has been performing best (Figure 3), registering 3.1 percent in the calendar year 2016. This is roughly consistent with Montana income tax withholding, the sole bright spot in the income tax collection reports, which grew by 2.8 percent in the same year. The most volatile component of earnings has been business proprietor income, which turned from strong growth in 2015 to a decline of 5.6 percent in 2016.

It has been the other components of income tax collections – estimated payments, refunds, final payments – which led to overall declining revenues in 2017. The big surprise for Montana generally comes in the spring, when most taxpayers settle up on their previous tax year liabilities. For both the U.S. as a whole, as well as in Montana, both final payments and refunds, which are negative revenue for the treasury, were bad in the spring of 2017 compared to the spring of the preceding year (Figure 4).

Other Explanations for Revenue Stagnation
While there is a consistency between income growth and income tax receipts for fiscal year 2017, the far-from-perfect relationship between the two measures over the past 15 years leaves room for other explanations for stagnant receipts. These include:
- The Trump effect. Since business owners do have discretion in deciding what year to record their income, the expectation of lower tax rates tomorrow could make wealthier individuals reduce their tax liabilities today. Past tax law changes at the federal level, such as changes in the tax treatment of capital gains, have produced dramatic changes around the tax change dates. The implication is that the recent weakness will be offset by unexpectedly higher revenues next year.
- Shifts in retirement disbursements. Not much is understood about the timing and behavior of disbursements from retirement accounts, which can cause changes in tax collections independent of other economic activity. Since there is withholding on many disbursements, this explanation is not entirely consistent with the observed behavior of tax receipts.
- The new economy. In an economy with increasing higher rates of mobility, telecommuting and online commerce, higher income households have more freedom to declare income in lower or zero income taxes. The implication is that Montana should be considering whether its tax system can adapt to this change to prevent the erosion of its base.
One last explanation is perhaps the most conventional one. That is to examine the income tax base.
The end of the oil boom in the Bakken affected state revenues in ways beyond the oil and gas severance tax. The loss of high wage jobs, reduced hours, reduced royalties and closures of business as the oil business contracted were all factor in Montana’s revenue woes. The current situation for Montana’s farmers and ranchers, beset by drought, wildfires and low prices, is another challenge that will certainly show up in the state’s bottom line.
There is no escaping the fact that the revenue forecast adopted by the Legislature overshot the actual trajectory of revenues. There is no shame in the error either – forecasting is a tough business and the events that produced the weaker revenue trajectory are still not fully understood. But the big picture descriptions of economic activity – personal income, earnings and wages – get us most of the way there.