The United States entered a recession on March 1, 2020. The recession was caused by the need to close the economy as the impacts of the COVID-19 pandemic began to ripple through the global economy. The pandemic brought an end the longest economic expansion in U.S. post-WWII economic history, lasting 10 1/2 years. COVID-19 and policy responses, both from an economic and health perspective, will lead to considerable uncertainty for some time to come.
Economic data for the second quarter of 2020 was dire. First quarter real GDP in 2020 fell 1.3%. Real GDP in the second quarter of 2020 was 9% or in annualized terms -31.4%. The third quarter of 2020 saw a resurgence of growth, 33.1%. But that is still 2.2% below the first quarter level of output.
Current forecasts for the U.S. economy show the rebound to continue. According to The Conference Board’s forecast, the annualized 2020Q4 growth will be 2.2% and their baseline forecast for 2021 is 3.4% real GDP growth. They predict the U.S. economy to recover to pre-recession levels by late 2021, but do not foresee the U.S. economy returning to its prerecession trend in 2021. Nevertheless, the most recent IHS Markit U.S. Manufacturing Purchasing Managers’ Index (PMI) augured an improvement for the manufacturing sector. However, employment is not keeping pace with expectations and supply chain delays and input shortages are likely to be a drag on the sector.
The impact on U.S. manufacturing has been considerable having already felt the impacts of an ongoing tariff war. Estimates have put the cost to the U.S. economy in the hundreds of billions of dollars per year. The effects of the COVID-19 pandemic have only worsened the economic environment. In March, the National Association of Manufacturers conducted a brief survey of the impacts of COVID-19 on the industry. The survey found:
- 35.5% face supply chain disruptions;
- Over 53% of manufacturing firms anticipate a change in their operations in the coming months;
- 78.3% say that uncertainty associated with COVID-19 will likely have a negative financial impact; and
- Roughly half of respondents stated their business has an emergency response plan.
Manufacturing in Montana
Manufacturing in Montana has remained a stable economic sector for the past decade. Between 2010 and 2019 manufacturing, as a share of total Montana employment, had risen slightly from 3.9% to 4.5% to 20,972. Similarly, manufacturing’s labor income as a share of total rose from 4.8% to 5.1% to $1.1 billion in 2019. Average annual pay by Montana’s manufacturers was $51,200 in 2019. By 2019 manufacturing climbed to 6.3% of total state gross state product to $3.4 billion.
Compared to the state average, manufacturing employment and total income have outpaced the state average. Employment and income were 29% and 55% respectively, higher than they were in 2010. Montana manufacturing has been growing relative to the U.S. as a whole. Nationally, manufacturing output grew an average of 3% between 2010 and 2019 and was 31% higher in 2019 than 2010. Correspondingly, Montana manufacturing employment also grew faster than the national average. U.S. manufacturing employment grew an annual average of 1.2% and was 11.4% higher in 2019 than in 2010.
Montana manufacturing does not have the same composition as the U.S. as a whole. Industries that are important in Montana are not necessarily important nationwide and vice versa. Figure 1 presents the composition of manufacturing earnings in Montana and the United States in 2018, the most recent data available.
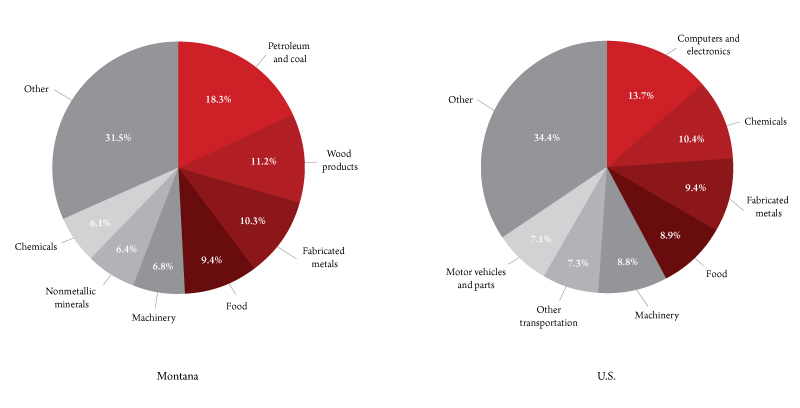
The two largest Montana manufacturing industries in 2018 were associated with the processing of crude oil and forest resources. Petroleum and coal products (primarily oil refining) was the largest manufacturing industry accounting for 18.3% of total manufacturing earnings in 2018. The next largest industry was wood products and furniture, representing 11.2% of earnings. Fabricated metal, food and machinery round out the top five accounting for 10.3%, 9.4% and 6.8% respectively.
The largest component of U.S. manufacturing during 2018 continues to be computers and electronics, which accounted for 13.7% of total manufacturing earnings. The next four industries were chemical products (10.4%), fabricated metals (9.4%), food products (8.9%) and machinery (8.8%).
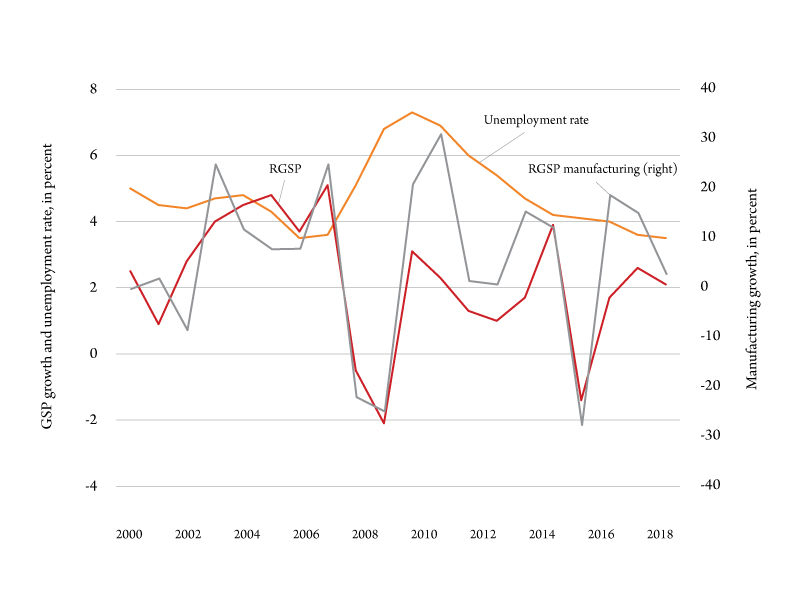
According to 2019 data, Montana’s economy is roughly in the same position as the U.S. as a whole. The 2019 unemployment rate averaged 3.5 percent and in constant 2012 prices real gross state product (GSP) averaged 2.1 percent. Manufacturing output growth averaged 1.3% in 2019, down from 13.6% growth in 2018 (Figure 2). As the figure also shows, real manufacturing output took a substantial hit during the Great Recession, falling roughly 30% compared to an overall decline in real GSP of 1.4%.
Manufacturing Outlook in Montana
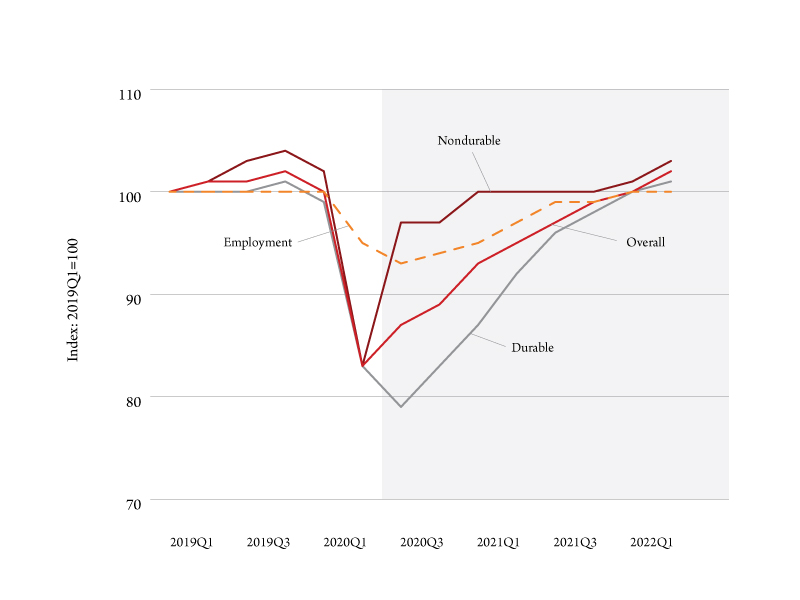
As with the national economy, the short-term severity of the COVID-19 recession requires that we look to the future to gain insight about current economic conditions that will affect manufacturing in the years to come. Figure 3 shows the forecasted index of overall, durable and overall manufacturing earnings from 2019Q1 to 2022Q2. As we can see, overall and nondurable manufacturing will fall almost 20%, at an annual rate in 2020Q1, while durable manufacturing will continue to fall into 2020Q3 before beginning to recover. By the end of 2022, manufacturing is estimated to recover to 2019Q1 levels. Manufacturing employment does not drop as sharply as earnings, but there is an approximately 8% decline in employment. While less pronounced than earnings, employment recovery growth is relatively slow and won’t return to 2019Q1 levels until 2022.
Manufacturer’s Outlook Survey
Montana manufacturers were queried about a number of indicators and whether they thought the indicator would increase, decrease or stay the same during 2020. The tables report the percentage of respondents who said the indicator would increase or remain unchanged in 2019. It should be noted that the survey was conducted before the COVID-19 pandemic, which will clearly impact future expectations.
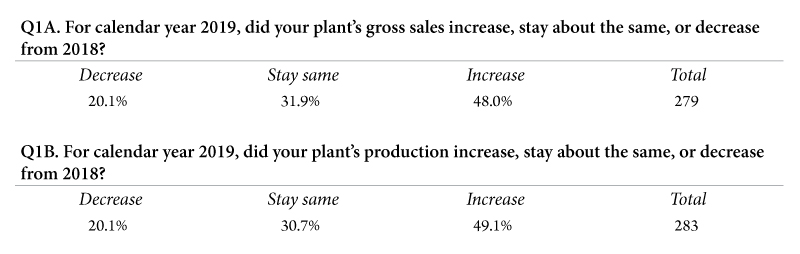
Montana manufacturers were asked to report on their plant’s performance in 2019. Survey respondents were queried about a number of indicators and whether it increased, decreased or stayed the same during 2019. Montana manufacturers reported that 2019 was a moderately positive year. Almost 50% of firms reported a better year than previously and 20% see a decline. Question 1 asked how Montana manufacturing fared vis-à-vis 2018 (Table 1). Overall, we can see that in 2019 about 80% of firms saw no change or an increase in their sales, production and profit compared to 2018.
Montana Manufacturers Response to COVID-19
The first recorded COVID-19 positives in Montana were on March 14 and the first death two weeks later. Since then, thousands of Montanans have tested positive and hundreds have died of the disease. In response, as in many parts of the country, Montana manufacturers shifted a percentage of their manufacturing toward producing goods to assist in the COVID-19 response. Shortages of personal protection equipment (PPE) and cleaning supplies have been well documented. But there have been some feel-good stories about Montana producers.
Several Montana distillers shifted production toward producing hand sanitizer using a formulation devised by the World Health Organization. However, the relatively unique nature of the pandemic and the ever complex supply chain system created a shortage of bottles and caps for the sanitizer. With help from the Montana Manufacturing Extension Center, five distillers in the state (Bozeman Spirits, Gulch Distillers, Headframe Spirits, Wildrye Distilling and Willie’s Distillery) received donations of 15,000 bottles and caps. While the bottle production was not located in Montana, Headframe in Butte coordinated the shipment and distribution of the bottles. Dean’s Zesty Booch in Bozeman provided caps when Wildrye only received bottles.
Montana manufacturers have also been instrumental in providing PPE to Montana, as well as other states. Health care givers from the Billings Clinic and Zaugg Dentistry designed a 3D printable surgical mask, which uses an insertable filter. Flowmark/High Tech Filters increased production of filters to fit the design. In addition to producing filters for in-state sales, they have also been taken orders from around the country. Ascent Vision Technologies worked with Bozeman Health to design face shields and are producing them for local health care facilities. And in Missoula, Rocky Mountain Biologicals are producing a viral transport medium used in COVID-19 testing.