Depression era bank robber Willie Sutton’s reasoning for why he robbed banks was summed up in a famous quote, “Because that’s where the money is.” The same logic helps explain why the Obama administration’s now suspended Clean Power Plan targeted coal-fired electric generating facilities. Of the roughly 5.7 billion metric tons of carbon dioxide (CO2) emitted in the U.S. in 2009 to produce energy, more than a third came from the burning of coal (Energy Information Administration, 2011).
Yet while advancing the retirement of coal-fired generators nationwide can pencil out as a means of reducing carbon emissions, the contributions of those still functioning power plants to both electric grids and to local economies would be lost as well. In Montana, a coal-producing state which has exported electricity to other states for four decades, those benefits are substantial (Barkey, 2015).
Consideration of those trade-offs leads to the question: Could meaningful reductions in carbon emissions in Montana be accomplished in ways that are less costly in terms of jobs, incomes and economic production?
An option that is rarely included in carbon policy discussions is wildfire management. Like other western states, Montana has experienced years of significant wildfire activity in recent decades. Since 2003, an average of almost 300,000 acres per year have burned statewide in both wildfires and prescribed fires. Those fires resulted in suppression costs – nationally running at about $2 billion per year (NIFC, 2017). And case studies suggest that suppression represents as little as 5 percent of true wildfire costs, when rehabilitation, health impacts and other indirect costs are taken into account (Western Forestry Leadership Coalition, 2010).
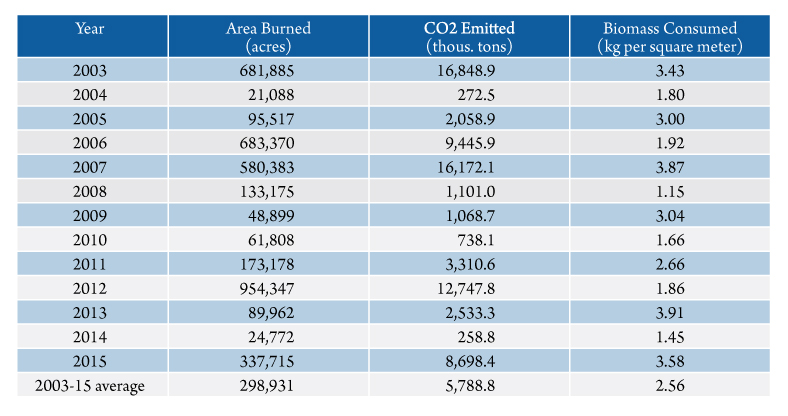
Those fires also emit significant quantities of CO2. Model-based estimates of CO2 emissions from wildfires in Montana for the past 13 years vary between a high of 16,849 thousand tons in 2003 and a low of 259 thousand tons in 2014. Those emissions, not surprisingly, resemble the pattern of acres burned in fire over the fire seasons of differing intensity over the recent past, as shown in Table 1. The variation in the intensity and fuel for the individual fires, however, makes this correlation far from perfect. The high year for acreage burned (2012) produced more than 20 percent less CO2 emissions than estimated for 2007, a year when significantly more biomass was consumed per square meter of fire.
There are many questions that would need to be addressed before wildfire management could be put forward as a realistic alternative – or addition to – other proposals and policies aimed at achieving reductions in CO2 emissions. A better understanding of the relative contributions of wildfires to total emissions is a good place to start.

Wildfire and Coal CO2 Emissions in Montana
The measurement of CO2 emissions from wildfires in Montana presents a more challenging problem than measuring emissions from the small number of coal-fired electric generators in the state. Not only is the fuel for wildfires and their thermal intensity highly variable, they are also spread across a wide geography that cannot be predicted in advance. Available estimates are based on models which take into account estimates of the areas burned, the types and quantity of fuels present, the proportion of fuel consumed and the completeness of combustion.
Of the two model-based estimates of wildfire CO2 emissions for Montana, the more comprehensive data used in the U.S. Forest Service (USFS) estimates presented in Table 1 make them preferable to those published by the Environmental Protection Agency (EPA). The latter are significantly higher than the USFS CO2 emission estimates for the select years, for which both are available. The availability of the USFS estimates for all of the years 2003-15, moreover, give a better depiction of the interyear variability in emissions stemming from the varying severity of fire seasons.
The EPA has published a comprehensive inventory of greenhouse gas emission sources for the U.S. annually since 1990. These include both energy-related emissions from the use of fossil fuels, as well as emissions from manufacturing, agriculture, and forestry and land use. For CO2 emissions at the state level, however, only energy-related emissions are reported.
Over the 1998-2013 period, the use of coal in Montana has emitted an average of 19.2 million tons of CO2 each year. Of that total, 17.2 million tons are accounted for by the operations of units 1-4 of the Colstrip Steam Electric Station in Rosebud County. Since the Corette generation station in Billings was closed in 2011, the operations of Colstrip SES account for an even larger share of emissions. Overall, coal accounts for roughly half of energy-related CO2 emissions in Montana.
A comparison of these emissions to the USFS estimates of wildfire emissions shown in Table 1 reveals that only in two years since 2003 – 2003 and 2007 – did CO2 emissions from wildfires approach the same magnitude as those from coal use. The average emissions of wildfires of 5.8 million tons of CO2 is about 30 percent as large as the average emissions from coal.
Nonetheless, given that coal is the single largest emitter of CO2 in the state and that coal emissions are spread over all 12 months of the calendar year, the data clearly show that wildfire emissions are significant enough to merit attention for policies aimed at CO2 reduction. And a reduction in wildfires would generate additional health benefits.
Other Emissions
Direct measurements of emissions from individual wildfires, such as those conducted from aerial measurements, show that wildfires in the U.S. and elsewhere emit significant amounts of pollutants that degrade air quality. In particular, wildfires emit significantly more pollutants – particularly small particulate matter – than prescribed burns conducted as part of forest management.

The EPA maintains an extensive state level database of emissions of air pollutants known to be associated with public health degradation. Some of the most important of these are carbon monoxide (CO), ammonia (NH3), nitrogen oxides (NOX), micron-sized particulate matter (PM10 and PM25), sulfur dioxide (SO2) and volatile organic compounds (VOC). The reduction of these emissions is not the primary goal of greenhouse gas reduction policy. But different policies to carry out CO2 reduction can have widely varying impacts on other emissions.
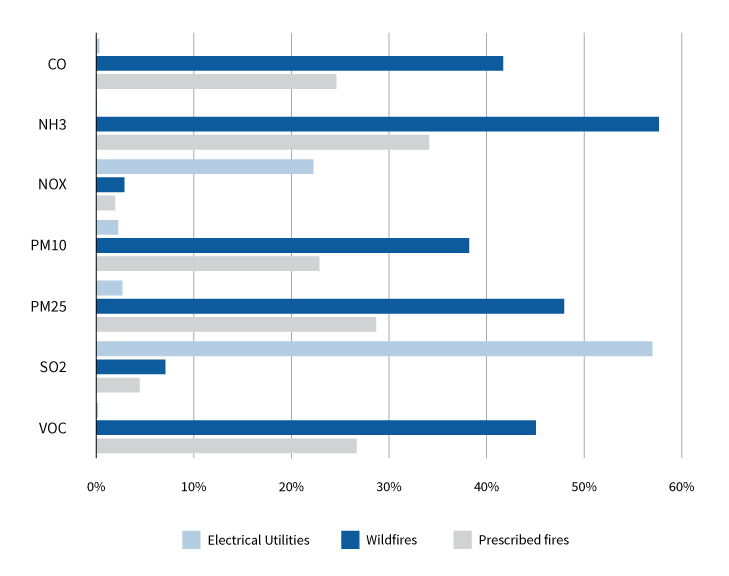
With the important exceptions of NOX and SO2 emissions, for which coal is a significant source, the emissions from this list of pollutants that occur because of wildfires and prescribed burns in Montana are several orders of magnitude higher than those from coal, as shown in Figure 1. The presence of particulate matter measuring 2.5 micrometers or less (PM25) in the atmosphere is the leading cause of global pollution-related mortality (Koplitz, et. al., 2016). The combustion of organic material in wildfires produces, on average, almost half of all of PM25 emissions statewide.
The variability, concentration and geographic aspects of wildfire smoke heighten the concern over their hazardous emissions. In heavy fire seasons, when the amount of biomass that is burned is higher, emissions can be two to three times the average. Those emissions also take place in a relatively short portion of the calendar year, so that annual emissions understate their presence in the air during fire events.

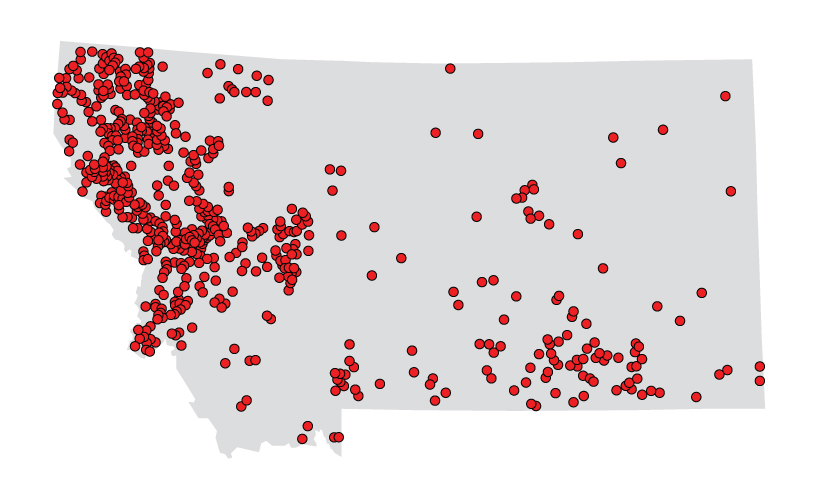
The geographic pattern of wildfire activity in relation to population density – particularly in comparison to coal – also can play a role in the relative health impacts of emissions. The predominance of fire activity in the western part of the state, as shown in Figure 2, not only puts their emissions in close proximity to Montana population centers, but it also means that prevailing wind currents carry those emissions across the state. The Colstrip electric generating stations, in contrast, are located east of the seven largest cities in Montana, upwind of the more sparsely populated areas of the state.
Implications for CO2 Reduction Policies
The emission data clearly show that emissions from wildfires – both CO2 emissions as well as those of other pollutants – are significant in Montana. We have compared those emissions to coal because so much policy attention has been paid to the latter as a means of achieving desired reductions in emissions of greenhouse gases that contribute to climate change. Expanding policy options to include actions aimed at curbing wildfire emissions might bring about CO2 emission reductions at a lower cost to the economy and at the same time make improvements to public health.
References
Barkey, Patrick (2015), “The Economic Implications of Implementing the EPA Clean Power Plan in Montana,” produced by the Bureau of Business and Economic Research, University of Montana for NorthWestern Energy, November 2015.
Urbanski, S.P., W. M. Hao and B. Nordgren (2011), “The Wildland Fire Emission Inventory: Western United States Emission Estimates and an Evaluation of Uncertainty,” Atmospheric Chemistry and Physics, 11, 12973-13000, 2011.
Koplitz, S.N. et. al. (2016), Public Health Impacts of the Severe Haze in Equatorial Asia in September-October 2015, Environmental Research Letters, 11, 2016.
National Interagency Fire Center, Federal Firefighting Costs (Suppression Only), www.nifc.gov.
Energy Information Administration, “Emissions of Greenhouse Gases in the U.S.,” www.eia.gov.
Western Forestry Leadership Coalition (2010), The True Cost of Wildfire in the Western U.S., www.thewflc.org.


