
Economists are sometimes accused of having little foresight, like a driver traveling at 90 mph with their eyes on the rearview mirror. But accurate economic analysis requires up-to-date information, and therein lies the rub. It takes time to gather, compile, verify and publish the data. By the time these steps are taken, it may appear that the figures are already out-of-date.
The current COVID-19 crisis is a prime example. The economy was barreling along in January and February of 2020, with record low unemployment and respectable growth. Then the world stopped in mid-March. When it resumed, it was on a different course. Much of the economic data, which is released annually or perhaps quarterly, simply can’t describe recent events.
There is one source of timely up-to-date data that can provide information; the Current Employment Survey (CES). Each month the U.S. Bureau of the Labor Statistics surveys about 697,000 work sites in the country and tallies the number of workers, as of the 12th of the month. The number of workers are reported nationwide, statewide and for each major metropolitan statistical area (MSA).
This data source is not perfect, because the figures are based on samples and are frequently revised. But if we are careful, and do not try to be too precise, the CES data can provide a picture of the latest trends. The following sections use the monthly CES data to track the COVID-19 recession in the U.S., Montana and several of the state’s major urban areas, since February 2020. Later data for gross domestic product and income will provide further information.
The U.S. Economy
The seasonally adjusted monthly data for U.S. nonfarm employment are shown in Figure 1. Nonfarm employment is the best overall indicator of short-run trends. Data for wages and income may be skewed by the massive income payments made by the federal government since the onset of the COVID-19 crisis.
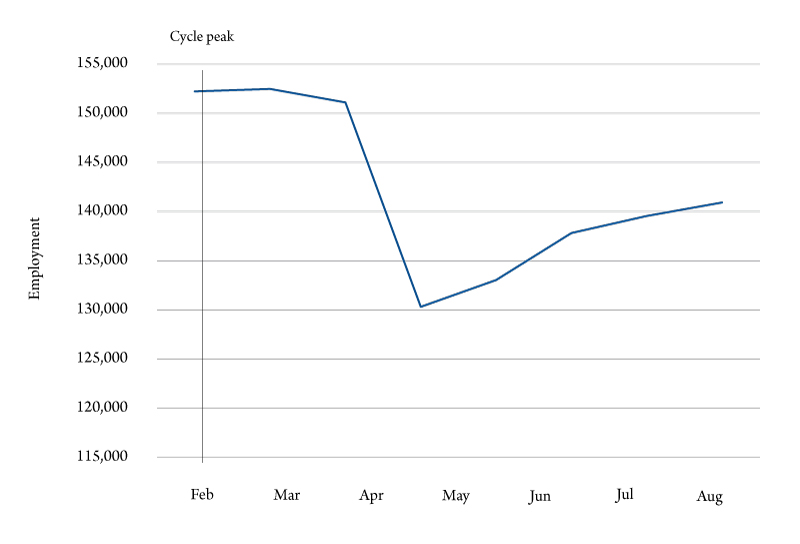
The rapid COVID-19 shutdowns during March and April of 2020 are clearly shown in the data. Total U.S. nonfarm employment declined by more than 22 million jobs from February to April, a decline of about 14.5%. We haven’t done an extensive historical search, but such a decrease has to be among the greatest month-to-month declines in recent history. There is no question that the U.S. economy went into a free fall in the spring of 2020.
Since the decline, the U.S. has posted a number of months of employment growth. By August 2020, the number of nonfarm jobs increased by almost 10.6 million. This job growth was impressive, but not close to erasing the 22 million decline from February to April, and the upward trend appears to moderate in July and August.
The National Bureau of Economic Research (NBER) is the semiofficial agency for dating of business cycles. They announced that February 2020 was the business cycle peak. This was bit surprising, because in the past it would take the NBER months or even years to determine when a business cycle began and ended. In any case, February 2020 provides a convenient starting point to analyze the COVID-19 recession and compare it to previous downturns.
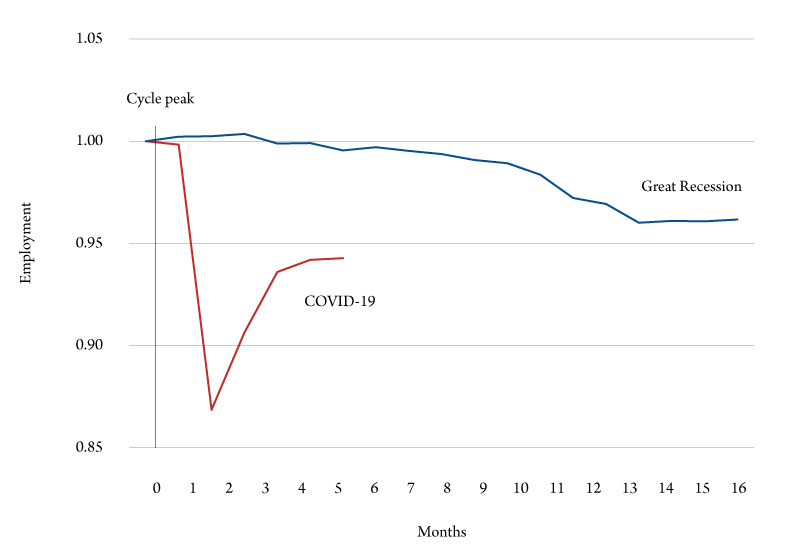
Figure 2 compares the first few months of the COVID-19 recession with the Great Recession of 2007-09. Both recessions may be plotted on the same graph by starting with the respective cycle peaks (February 2020 for COVID-19 and December 2007 for the Great Recession) and plotting the following months relative to the cycle peak.
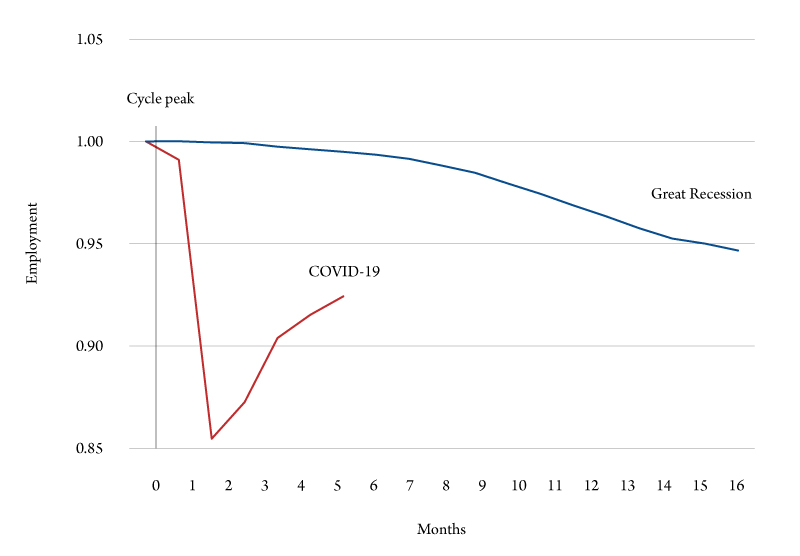
The differences between the two recessions are immediately obvious. The Great Recession was 18 months of slow but persistent declines. By June 2009, nonfarm employment was down slightly more than 5%. The COVID-19 recession so far has had larger declines over a much shorter period of time. As mention earlier, the two-month decline in 2020 was roughly 14.5%.
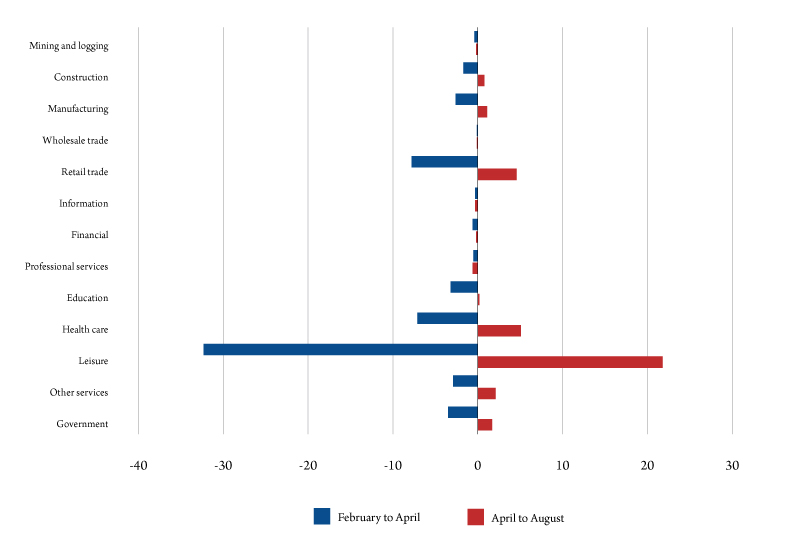
The distribution of employment losses and gains provides further insight into the characteristics of the COVID-19 recession. Figure 3 shows the nonfarm industry employment changes from February to April (those on the left) and the corresponding industry figures from April to August (those on the right).
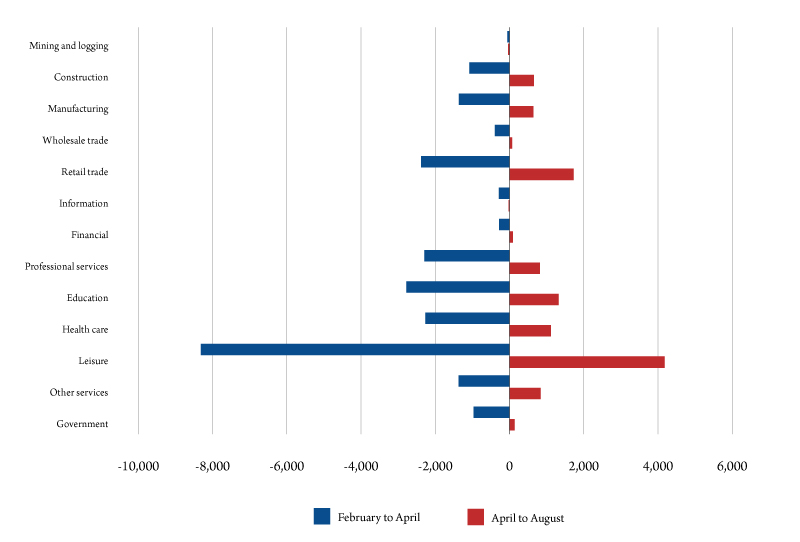
All of the industries shown in Figure 3 experienced employment declines during the spring of 2020. The greatest decreases were in the hospitality and leisure sectors (hotels, motels, restaurants and bars). These industries lost more than 8 million jobs or almost 50% of its February figure. Retail trade and heath care also saw significant job losses. Taken together, hospitality, retail trade and health care accounted for almost 59% of the total job losses.
The greatest increases between April and August of 2020 were in the industries that experienced the largest declines. Taken together, hospitality and leisure, retail trade and health care accounted for more than 66% of the job growth between April and August. This suggests that much of the decreases and subsequent increases were associated with the shutdowns and (partial) reopenings due to stay-at-home orders.
The Montana Economy
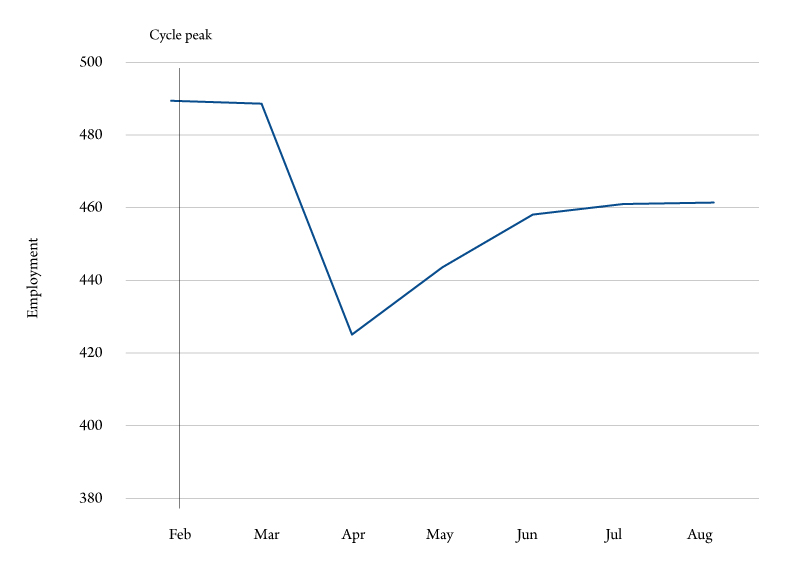
Figures 4 to 6 present the monthly CES data for Montana in the same format as the U.S. figures. This allows quick comparisons between COVID-19 trends in the state and the nation.
As shown if Figure 4, seasonally adjusted nonfarm employment in Montana declined sharply during the spring on 2020. The number of workers decreased from 489,400 in February to about 425,100 in April, down about 13.1%. The corresponding drop in U.S. employment was 14.5%. As with the nation, Montana experienced sizable increases in the April to August period, but the latest employment figures were still slightly more than 5% below the February peak, and the July and August growth was modest.
The Montana COVID-19 trends are compared to those during the Great Recession in Figure 5. As with the U.S. economy, the COVID-19 data is far more volatile than for the nation. The February to April Montana decline was greater than experienced during the entire Great Recession, as were the April to August increases.
The industry distribution of the 2020 Montana employment changes can be seen in Figure 6. As in the nation, both the February to April declines and the subsequent April to August increases were concentrated in just a few industries. Leisure, health care and retail trade accounted for 73.4% of the declines and roughly 86.8% of the increases.
Montana’s Major Urban Areas
The U.S. Bureau of Labor Statistics also gathers and publishes CES employment data for metropolitan statistical areas (MSA). There are three in Montana; Missoula, Great Falls and Billings. Unfortunately, the fast growing Flathead and Gallatin counties are not yet designated as MSAs and data for them is not available. As mentioned earlier, CES figures are based on samples and should be taken with a grain of salt and the MSA data should be taken with the most salt. MSA sample sizes are small, meaning that the figures may be imprecise and could be revised when more information becomes available.
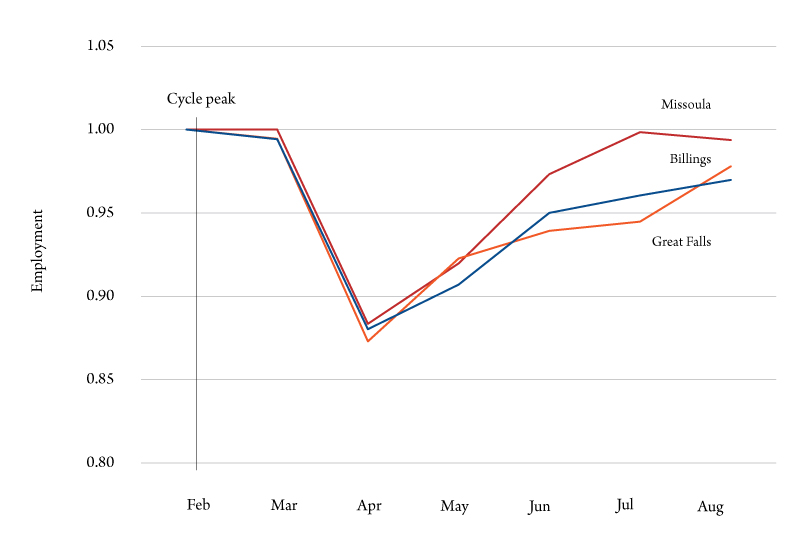
Seasonally adjusted nonfarm employment for Missoula, Billings and Great Falls are presented in Figure 7. All three MSAs are shown on the same graph in the interest of brevity and because their trends are so similar. The declines from February to April are simultaneous in all three cities and almost equal in magnitude. They range from an 11.6% decline in Missoula to a 12.7% decrease in Great Falls. Similarly, nonfarm employment turned upward in April 2020. By August, employment in Missoula regained its February peak, while the figures for Great Falls and Billings remained about 5% below the cycle maximums. All three MSAs experienced moderating growth in July and August of 2020.
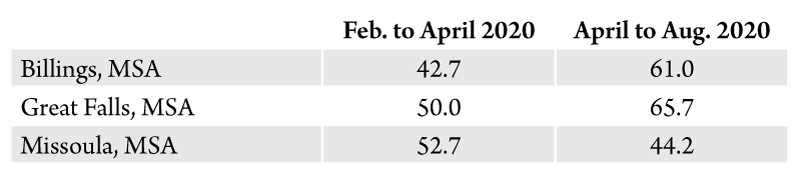
Small sample sizes limit the amount of detailed employment available for MSAs. Of the categories reported in Figures 3 and 6, only employment in leisure is reported for the three Montana MSAs. But even so, this category accounted for large portion of the 2020 changes in Montana urban areas.
As reported in Table 1, leisure was 42.7% to 52.7% of the February to April declines, and 44.2% to 65.0 % of the April to August increases in total nonfarm employment in Montana’s three MSAs.
Summary
The COVID-19 crisis has had significant repercussions throughout the economy. Using Current Employment Survey data published by the U.S. Bureau of Labor Statistics (one of the few monthly economic data sources) reveals the following:
- The U.S., Montana and three of the state’s urban areas experienced sharp declines from February to April 2020 and increases from April to August, with moderating growth in July and August. Current employment levels remain mostly below peak values.
- The employment declines in the U.S., Montana and the urban areas were much greater than were experienced during the Great Recession. These decreases were probably larger than at any time in recent history.
- The changes in employment in the U.S., Montana and the MSAs were concentrated in a few industries. Leisure, health care and retail trade accounted for most of the declines and subsequent increases during 2020.
The concentration of 2020 impacts in a few industries suggests that they may mostly reflect the lockdowns and subsequent (partial) reopenings associated with the pandemic. Recessions, on the other hand, usually involve simultaneous trends in a wide variety of industries. If the events identified here spread to the rest of the economy, the COVID-19 recession may have a long way to go. If the impacts are confined to several industries (perhaps due to government fiscal and monetary policies), the recession may be shorter.